Your portfolio team just got told to “track AI visibility,” and now you're staring at five tools, eight sub-brands, three regions, and an executive who wants one clean rollup by Friday. Every brand lives in a different workspace, the prompts aren't aligned, and half the team still thinks this is just SEO with a new label. It isn't.
AI visibility monitoring for enterprise multi-brand portfolios breaks the moment you try to run it like a single-brand dashboard. The problem isn't getting data, it's keeping the data comparable when ChatGPT, Claude, Perplexity, Gemini, and Google AI Overviews all answer in different ways, with different citations, different ordering, and different levels of brand presence. Once you scale past one brand, monitoring becomes a governance problem, a workflow problem, and a reporting problem at the same time.
The teams that get this wrong usually make the same mistake, they buy a tool, then ask it to behave like a portfolio operating system. That's where the wheels come off.
Table of Contents
- The Multi-Brand AI Visibility Problem
- Which Metrics Define AI Visibility for a Portfolio?
- Start with one comparable daily number
- Use buyer prompts, not vanity prompts
- Prompt Sets and Probe Design at Portfolio Scale
- Separate universal and brand-specific work
- Hold the line on cadence
- How Should a Portfolio Structure Its Workspaces?
- Own the taxonomy once, not everywhere
- Use the portfolio view for leadership, not editing
- Integrations and Reporting Workflows
- Route alerts to the right people
- Make recurring reporting reusable
- Why Does Interface Fidelity Change the Numbers?
- Vendor Selection and Example Use Cases
- Use cases that expose the difference
- Test the platform against production reality
The Multi-Brand AI Visibility Problem
Reviewed 19 September 2026. The multi-brand problem is that one dashboard cannot answer for every brand at once. A portfolio CMO usually sees the failure after the second acquisition or the fourth regional rollout. One brand team tracks pricing prompts, another tracks alternatives, and a third copies last quarter's query library without cleaning up the competitor set. The result looks orderly in a slide deck and fractured in the workspace.
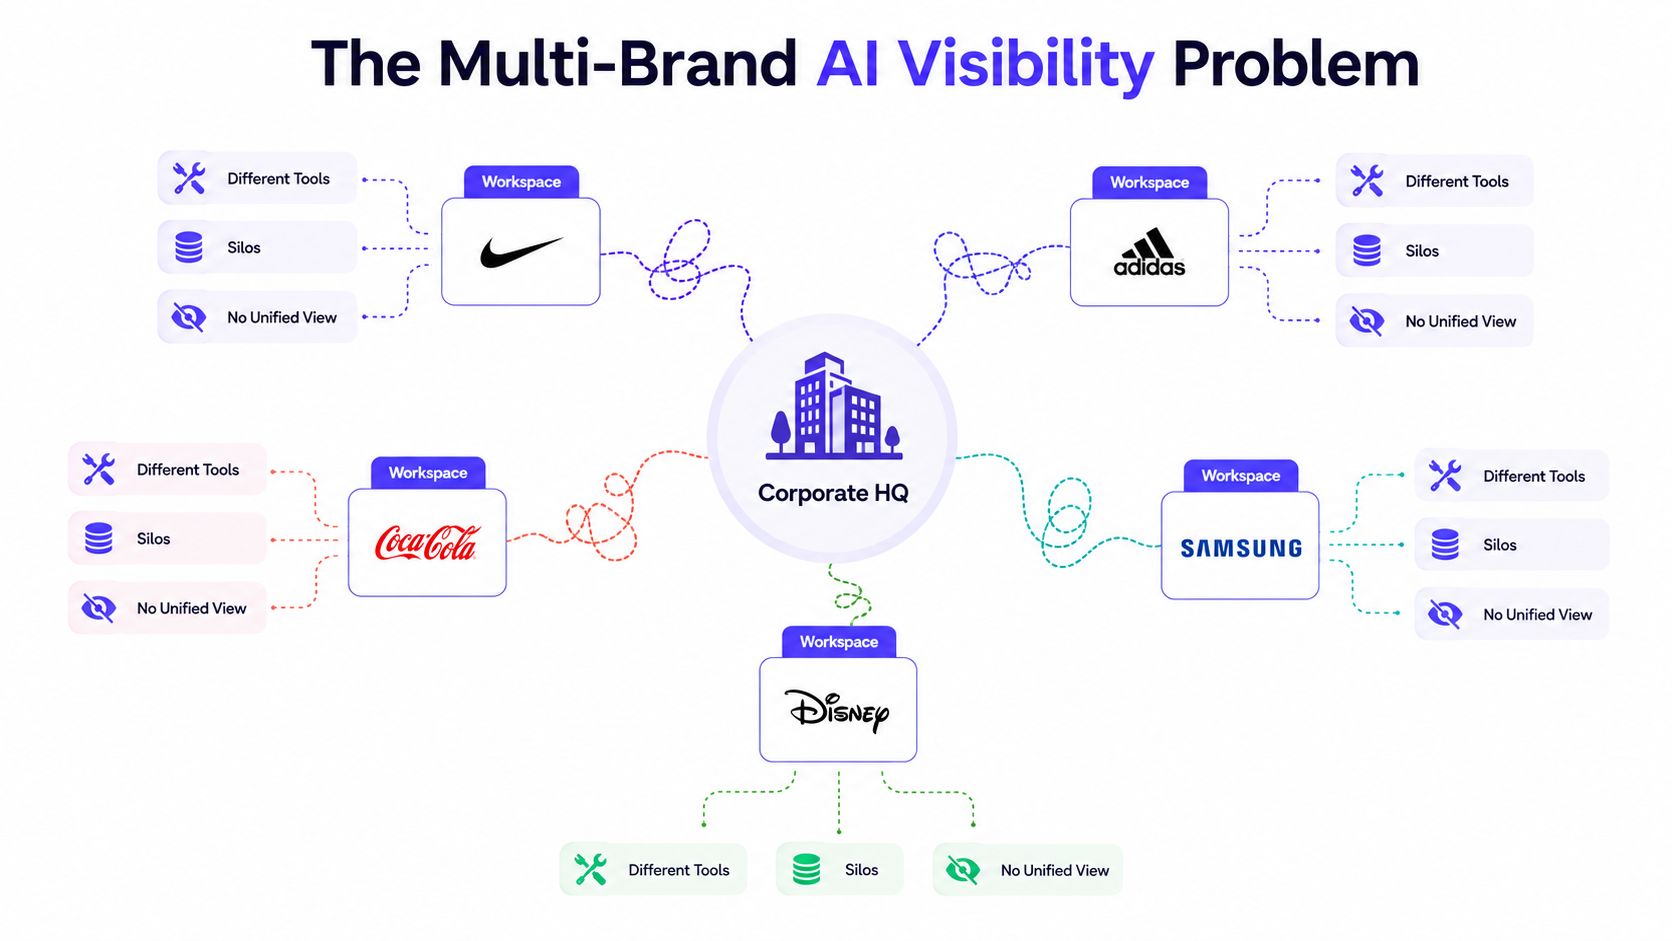
A single-brand workflow falls apart in a portfolio. Once you are monitoring ChatGPT, Claude, Perplexity, Gemini, and Google AI Overviews across multiple brands, the job becomes governance first and tooling second. The work shifts to keeping prompts comparable, keeping workspaces clean, and keeping the reporting logic consistent enough that one brand's results can be compared with another's without confusion.
The problem is not just volume. It is drift. Teams create slightly different prompt sets, use different competitor lists, and apply different baselines, then treat the output as if it came from one controlled system. That produces a false sense of progress, because the numbers move while the underlying method keeps changing.
Practical rule: if your executive rollup cannot preserve brand-level history, it is not a portfolio dashboard, it is a screenshot collection.
Access control is where these programs often break next. Enterprise platforms can hold many brand domains in one workspace, but that only works if workspace isolation, permissions, and naming discipline are tight enough to stop teams from contaminating each other's baselines AIRankLab. If you have ever seen one client's prompts leak into another client's report, you already know the failure mode. The PostPulse account isolation guide shows why clean separation matters when multiple accounts share one operating environment.
This is a governance problem with workflow consequences. Traditional SEO tolerated broad keyword buckets and fuzzy handoffs. AI answer monitoring does not. The buyer sees one synthesized response, and each brand is either present in the right context or absent from the conversation.
Which Metrics Define AI Visibility for a Portfolio?
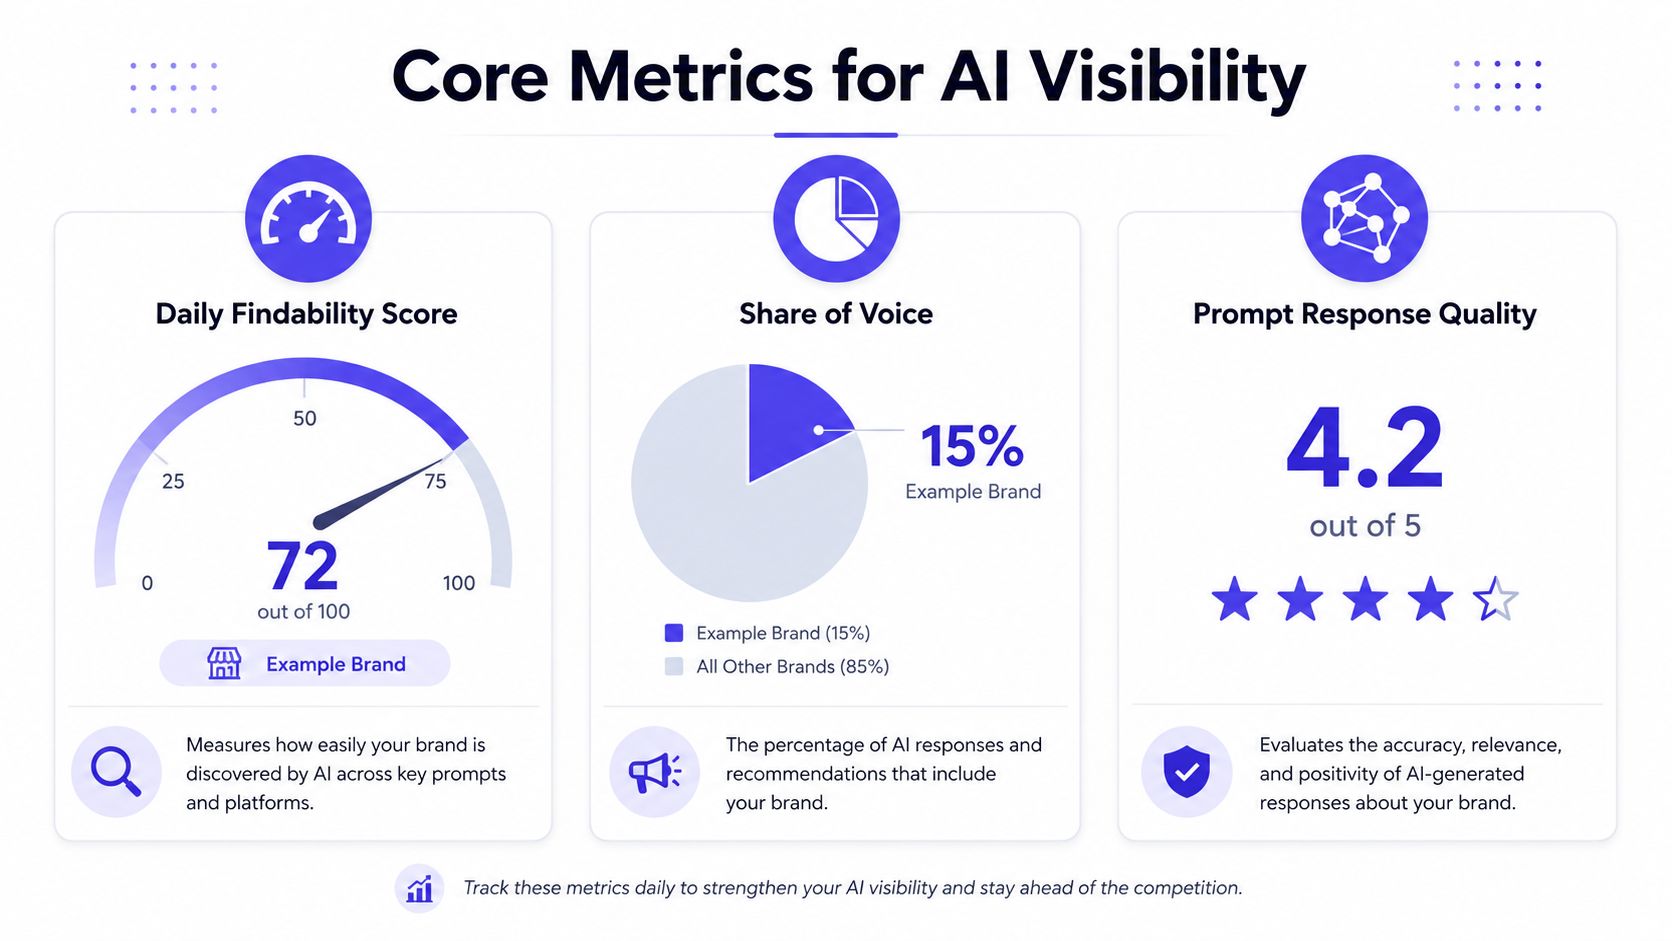
Four metrics define AI visibility for a portfolio. A team needs a small set of numbers executives can use without arguing over definitions. Three metrics matter most in practice, Answer Rate, Share of Voice, and Average Citation Rank. If your dashboard cannot reduce AI visibility to those three layers, it is collecting data, not driving decisions.
Start with one comparable daily number
Start with one comparable daily number: Answer Rate belongs on the executive dashboard first. It gives every brand one daily, comparable measure of whether AI engines can surface it across the prompt set. That is the cleanest way to answer the board-level question, “Are we showing up?” without forcing leaders to read model-by-model noise.
The second layer is Share of Voice. In portfolio terms, this is the share of buyer prompts where your brand appears relative to named competitors. It tells you whether one brand is taking attention while another fades from the answer set. For a CMO, this is the number that shows competitive drift before it turns into pipeline loss.
Then there is Average Citation Rank, which shows where your brand sits when it is cited. A citation that appears first is not the same as one buried late in the response. In a buyer journey, placement changes whether your brand feels like the default option or a footnote.
Use the shelf test: Answer Rate is whether shoppers can find your product, Share of Voice is how often they pick it up, and Average Citation Rank is how high it sits on the shelf.
Use buyer prompts, not vanity prompts
These metrics only matter when they come from real buyer prompts, such as pricing, alternatives, and best-of queries. Enterprise systems that track AI visibility across up to five direct competitors in the same dataset are doing the right kind of comparison, because portfolio leadership needs side-by-side context, not isolated bragging rights. The score only works if the query library reflects how buyers ask.
For a portfolio, I'd keep the executive view brutally simple:
- Answer Rate: one number per brand, one rollup for the portfolio.
- Share of Voice: the competitive share against named rivals.
- Average Citation Rank: placement quality when the brand appears.
Everything else belongs in the workspace, not the board deck.
Prompt Sets and Probe Design at Portfolio Scale
Governance, not prompt volume, becomes the bottleneck once a portfolio crosses a dozen brands. If every team invents its own prompts, comparability breaks before the first executive readout. The portfolio standard is simple: universal queries for every brand, brand-specific probes for product lines and regions, and competitor-pressure prompts for the places where rivals keep winning.
Separate universal and brand-specific work
Universal queries should cover the questions every buyer asks, regardless of brand. Brand-specific probes should cover what only one product line, region, or acquired company needs. That split tells you whether a visibility drop is portfolio-wide or confined to one market.
A practical taxonomy looks like this:
- Universal queries: category comparison prompts, feature-based questions, pricing questions.
- Brand-specific probes: product-line questions, regional questions, acquisition-specific naming.
- Competitor-pressure prompts: named competitor comparisons, “best of” queries, alternatives.
That structure keeps prompt drift under control. It also lets analysts compare one brand's performance against another without forcing them into the same artificial template. A newly acquired brand is where taxonomy decay shows up fastest, because the inherited naming rules rarely match how buyers search.
Hold the line on cadence
Daily capture is the right cadence. AI answers change quickly enough that stale data turns into a reporting liability. One enterprise framework recommends starting with 50 to 100 priority prompts per brand and expanding quarterly as new high-value questions surface AEOVision. That is the right balance between signal and effort, but staying disciplined means keeping prompt intent stable when teams start rewriting queries to chase better results.
The failure mode is familiar. A portfolio adds an acquired brand, the local team keeps the old naming conventions, and half the library starts mixing legacy product names with the new house style. Then the reports look inconsistent, not because the brand changed, but because the prompt set drifted.
The AppLighter guide on improving AI feature reliability is useful if your team needs tighter discipline around prompt structure and repeatability.
Don't let every brand team “optimize” its own prompt set. That is how you end up with incompatible reports that no executive trusts.
For teams that want a reference point on AI answer source behavior, the GetIntel Perplexity citation sources data overview is a useful example of why source-level consistency matters when prompts are reused across brands.
How Should a Portfolio Structure Its Workspaces?
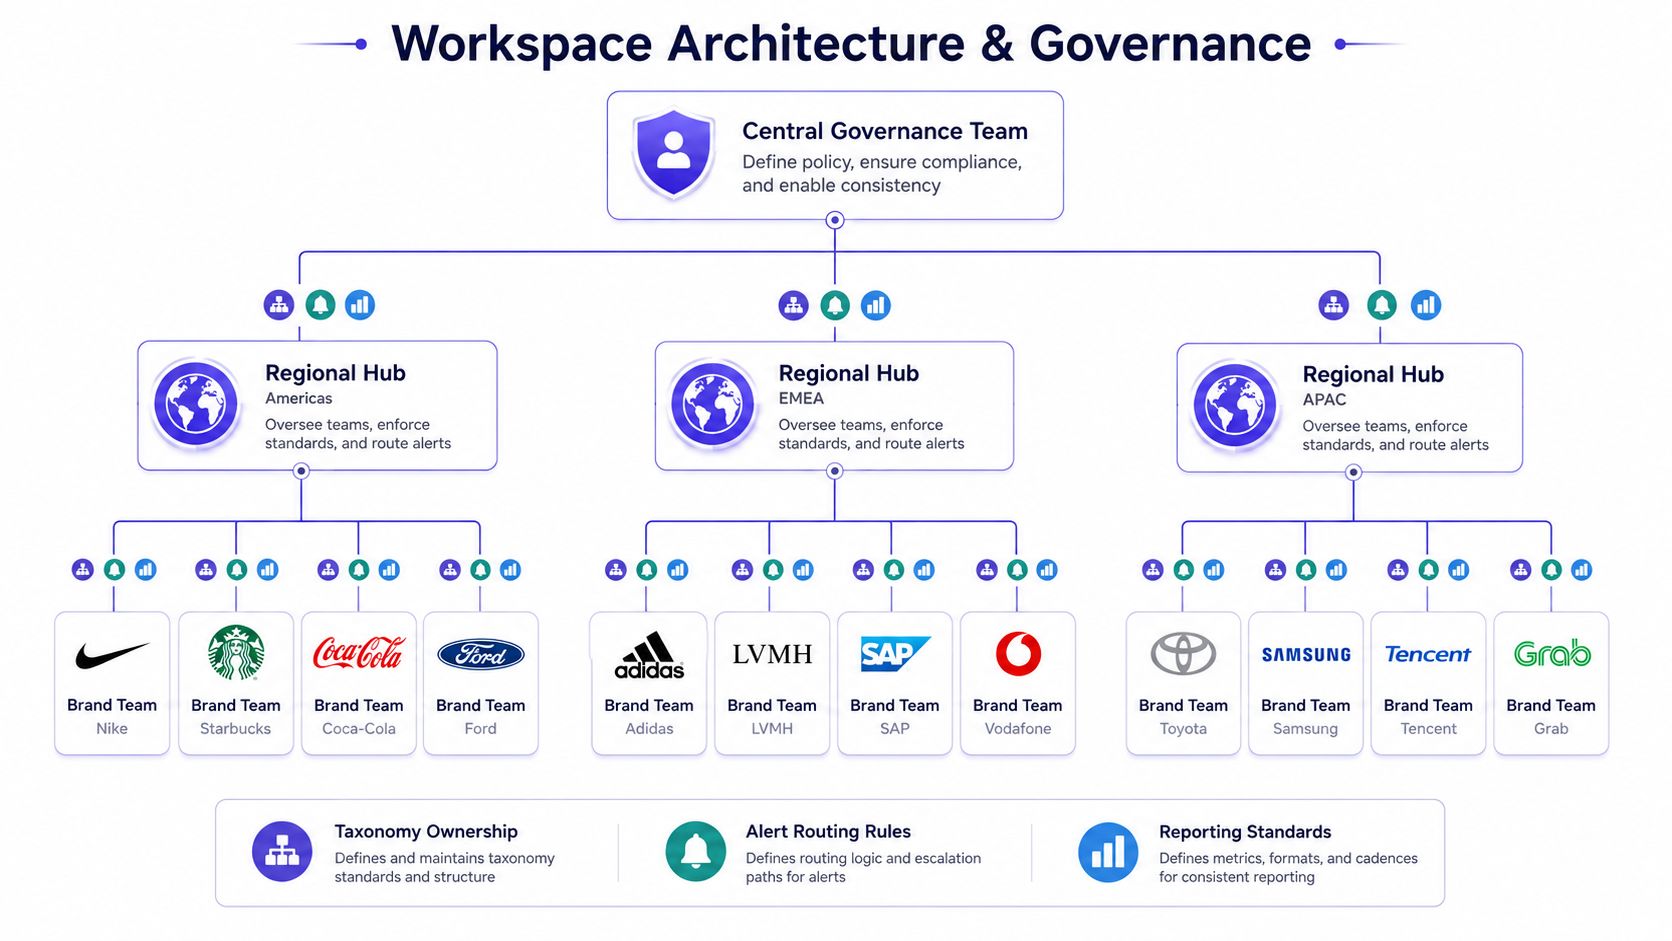
The cleanest operating model starts with a central account and separate workspaces for each product line, region, or acquired company. Each workspace needs its own prompt set, competitor list, and baseline, while the executive layer only sees the portfolio rollup. Anything less turns into a reporting argument every time a brand gets added, renamed, or reassigned.
Workspace isolation protects continuity. Each acquired brand should keep its own history, its own benchmark, and its own query library, rather than being folded into a shared set that blurs the trendline. If you merge brands too early, you lose the ability to tell whether visibility improved or whether the reporting model changed underneath you.
Own the taxonomy once, not everywhere
The common failure is organizational, not technical. Duplicate prompt libraries, conflicting taxonomies, and brand-level reporting mistakes show up when no one owns the rules. Qwairy's enterprise approach reflects the right control pattern, one owner per workspace, portfolio-level taxonomy definitions, and a clear escalation path when visibility drops or competitor gaps widen Qwairy.
A central governance team should define the categories that matter across the portfolio. Brand teams should own the local nuance inside their own workspace. That split keeps the data comparable without flattening regional or product-line differences.
The taxonomy has to be consistent enough for leadership to compare brands, but flexible enough for local teams to reflect product reality. If one group tags a category as a campaign, another as a product line, and a third as a market, the dashboard stops being a management tool and becomes a translation exercise. Governance exists to stop that drift before it reaches reporting.
Use the portfolio view for leadership, not editing
A central dashboard should aggregate results for executives, but executives should not be editing prompt sets or taxonomies. Give them the rollup, the competitor gaps, and the trendlines. Let workspace owners manage the probes and the interpretation inside their own boundaries.
Governance rule: if a prompt can affect a board report, it needs an owner, a taxonomy label, and a baseline date.
That is the right separation of duties for enterprise AI visibility monitoring. Leadership gets one view of the portfolio. Operations gets the control surface. No one should be improvising definitions in the middle of a reporting cycle.
Integrations and Reporting Workflows
A dashboard that nobody checks is just expensive wallpaper. Integrations turn AI visibility from a static report into a workflow that changes behavior, and that is where enterprise teams win back time. The stack I would insist on is straightforward, Google Search Console for traditional search context, Ahrefs for backlink and competitive context, Slack for routing, Zapier and webhooks for workflow delivery, and API or MCP access for teams that want the data in a warehouse.
Route alerts to the right people
Tiered alerting has to be built in from the start. One enterprise guide defines critical alerts as a 10%+ citation drop in a week and significant alerts as a 5 to 10% drop, with routing rules that send all alerts to the central SEO team and only product-line alerts to the relevant business-unit marketers Brandlight. That is the level of discipline required when a portfolio spans multiple brands and regions.
| Severity | Threshold | Recipient | Routing Channel |
|---|---|---|---|
| Critical | 10%+ citation drop in a week | Central SEO team, relevant BU lead | Slack, webhook, email |
| Significant | 5 to 10% citation drop in a week | Product marketing for the affected brand | Slack, Zapier, webhook |
| Watchlist | Below 5% drop, but trend moving | Workspace owner | Dashboard and weekly digest |
Slack, Zapier, and webhook routing matter because they push changes into the systems teams already use instead of forcing someone to log into a dashboard for every brand. That is the difference between a report and a response.
Make recurring reporting reusable
Scheduled white-label reporting keeps agencies and portfolio teams from wasting time on repeat work. As noted in the workflow guidance from Vectoron, portfolio-ready systems need multi-tenant workspaces, white-label reporting, per-client prompt libraries, and seat models that scale. In practice, that means a client or sub-brand report can run on schedule without manually rerunning and rebranding the same analysis every time.
That feature should serve operations, not vanity. If the same baseline does not flow through the recurring report, the dashboard, and the alert trail, portfolio leaders end up debating versions instead of acting on visibility shifts.
The operational test is simple. If a visibility change lands in Slack, the owner should know what happened. If it lands in a scheduled report, the client or brand lead should see the same baseline, not a fresh version of the truth.
Why Does Interface Fidelity Change the Numbers?
If leadership is going to challenge a visibility shift, the capture method has to mirror what buyers saw. Rendered answers matter more than cleaned-up exports, because brand mentions show up in paragraphs, side panels, footnotes, and ordered lists, and that layout changes what gets noticed first.
A simple example makes the failure obvious. If ChatGPT puts two competitors ahead of your brand and cites both at the top, the answer is still a loss even if an API summary makes the output look neutral. Average citation rank only means something when it reflects the rendered experience, not a stripped-down feed that hides the placement buyers saw.
Executives do not care about theoretical presence. They care about whether the model named the right competitor first, whether the brand was cited at all, and whether the answer positions your company as the default choice or as an afterthought. The GetIntel comparison of API output versus the live ChatGPT interface is a useful reminder that fidelity gaps create false confidence.
Do this: capture what the buyer sees, not what the API chooses to expose.
Competitor benchmarking belongs in the same workflow. When you compare prompt standings against named rivals, the monitoring report stops being descriptive and starts becoming a roadmap. That gives content, authority, and entity work a direct path back to the exact questions where your brand trails.
Interface-level capture fidelity is the harder problem at scale. If the capture method does not match the interface, the executive story will always trail the buyer experience.
Vendor Selection and Example Use Cases
Selection should be a scorecard, not a logo exercise. Start with the basics, multi-brand workspace support, seat and brand limits that scale by tier, white-label report scheduling, integration coverage, and whether the platform can turn gaps into a ranked task list across on-page, off-page, UGC, and technical fixes. If the vendor can't connect that task list to a coding agent working in your own repo, it's only halfway useful.
Use cases that expose the difference
An agency running a dozen client brands needs scheduled white-label reports, recurring client scorecards, and enough workspace isolation that every client sees only its own data. A portfolio enterprise team needs the same underlying mechanics, but with a central dashboard, per-brand workspaces, Slack-routed alerts, and API access for the data team.
GetIntel is one option in that category. It measures visibility across ChatGPT, Claude, Perplexity, Gemini, and Google AI Overviews, scores buyer questions grouped into topics daily, supports multi-brand management with scheduled white-labeled reports, and includes integrations for Slack, Zapier, webhooks, Google Search Console, Ahrefs, and API or MCP access. That combination matters because it ties reporting, routing, and remediation into one operating loop instead of splitting them across five tools.
Test the platform against production reality
Don't buy on demo polish. Test prompt library portability first, because you need to know whether the portfolio structure survives when a new brand is added. Then test daily refresh reliability, because stale data kills confidence quickly. After that, check white-label report fidelity and whether the platform can hand changes to your team's own repository or CMS rather than just exporting a PDF.
The proof-of-value should also include seat and brand limits. Some platforms look flexible until you try to scale access across agencies, regional teams, and executives. Others make white-label delivery sound easy but collapse when you ask for repeatable, portfolio-level reporting across dozens of brands.
If the platform can't keep one brand's taxonomy from leaking into another brand's report, it doesn't belong in a multi-brand portfolio.
The shortlist is short. Pick tools that can manage multiple brands cleanly, route alerts into your workflow, preserve historical baselines, and produce actionable outputs your team can publish without rework.
If you're managing AI visibility across a portfolio and you want one system for daily tracking, competitor benchmarking, white-labeled reporting, and workflow routing, take a look at GetIntel. It's built for teams that need to govern visibility across multiple brands instead of juggling disconnected dashboards. Visit it, compare it against your current stack, and see whether your reporting process can finally stop rebuilding the same analysis brand by brand.