Track it separately from everything else, because it is a separate surface. We measured how much each engine's cited sources overlap with the others on the same question, and Google AI Overviews shares just 4.8% of its cited domains with ChatGPT. On this measure, about one cited domain in twenty is shared between the two.
For a solo founder that has two consequences. Track AI Overviews on its own line rather than inside a blended score, because a blended number hides exactly this. And track it weekly rather than daily: roughly one AI Overviews run in five returns no citations at all, so a single daily check has a real chance of telling you nothing while costing you the one hour a week you actually have. Not that AI Overviews is harder or easier than the others, but that it is a different job.
Our figures cover the brand's full set of 130 tracked prompts across four engines between 10 July and 10 August 2026, of which 129 had both engines in a given pair return at least one citation. GetIntel tracks AI Overviews as a product, so the dataset is published.
Does ranking in ChatGPT mean anything for AI Overviews?
Almost nothing, on this evidence.
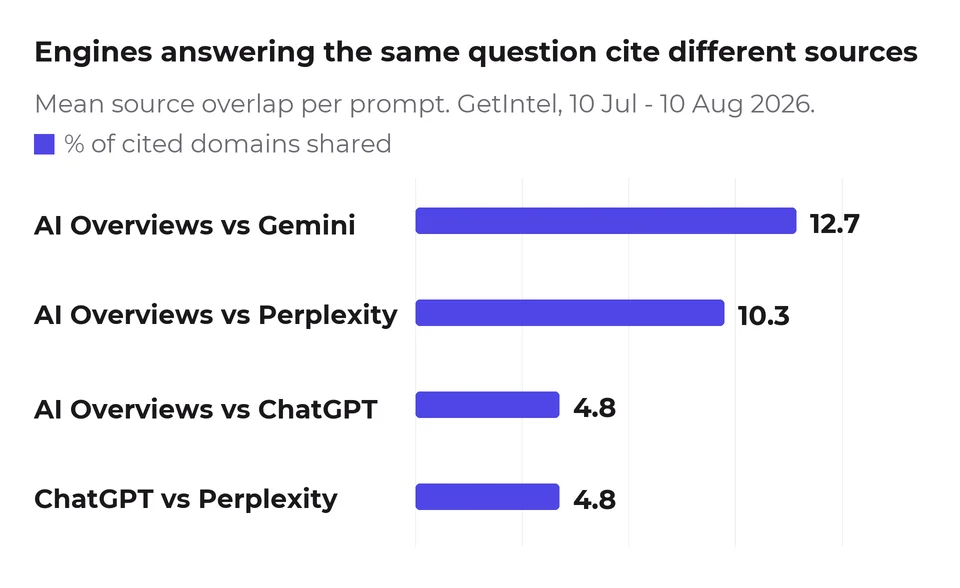
All six possible pairs, because publishing only the flattering ones would make the pattern below unfalsifiable:
| engine pair | shared cited domains |
|---|---|
| AI Overviews vs Gemini | 12.7% |
| Gemini vs Perplexity | 11.2% |
| AI Overviews vs Perplexity | 10.3% |
| AI Overviews vs ChatGPT | 4.8% |
| ChatGPT vs Perplexity | 4.8% |
| Gemini vs ChatGPT | 4.5% |
The two Google surfaces are each other's closest partner, and that is mutual rather than one-sided: Gemini's nearest is AI Overviews and AI Overviews' nearest is Gemini. But the margin is thin. Gemini is only 1.5 points closer to AI Overviews than to Perplexity, which is not enough to lean on.
The sturdier pattern is the other one. ChatGPT is the outlier: its three pairings are 4.8%, 4.8% and 4.5%, the three lowest figures in the table. Whatever ChatGPT is doing to select sources, it is the least like everyone else, and that holds across all three comparisons rather than resting on a single one.
One caveat that cuts against the drama. We measured overlap at the domain level, not the page level, which is the more generous of the two. Two engines citing different pages on the same site both count as agreement here, so the true page-level overlap is no higher than 4.8% and almost certainly lower.
How often does AI Overviews cite anything at all?
Least often of the four, though the gap to the best performer is under eight points.
Across 1,280 runs per engine:
| engine | runs returning any citation |
|---|---|
| Perplexity | 85.9% |
| Gemini | 84.1% |
| ChatGPT | 79.1% |
| Google AI Overviews | 78.4% |
AI Overviews is lowest of the four. So roughly one AI Overviews query in five produces nothing to be cited in, which is a floor on how visible anyone can be there and a reason not to read a zero as a failure.
This matters for cadence. If a fifth of your checks can return nothing through no fault of yours, a single check that comes back empty is close to uninformative, which is the same trap as reading a single run as a measurement anywhere else.
What should a solo founder actually track here?
Three fields, checked weekly rather than daily, on a prompt set you do not change.
- Whether the AI Overview appeared at all. An empty result and an appearing-but-not-citing-you result are different events and collapsing them will corrupt your trend line.
- Whether you were named. The binary, not a position. Position is not stable enough in an AI answer to be worth tracking.
- Which prompts only this engine finds. Half our covered prompts appear on exactly one engine, so the unique-to-one-engine count is the whole argument for tracking more than one.
- Which domains it cited. This is where the actionable information is, because AI Overviews' sources are so different from every other engine's that you cannot infer them from what you already know.
Weekly rather than daily because the marginal information in a daily check is small and the time cost for one person is not.
In practice a week's log for a single prompt looks like four rows and takes a minute to read:
| week | overview appeared | we were named | domains cited |
|---|---|---|---|
| 1 | yes | no | 6 |
| 2 | no | n/a | 0 |
| 3 | yes | no | 8 |
| 4 | yes | yes | 5 |
Week 2 is the row people get wrong. No overview appeared at all, so it is not a week you were absent from the answer, it is a week there was no answer. Scoring it as a zero would drag a four-week average down by a quarter for a reason that has nothing to do with your brand, and at a 78.4% citation rate you should expect roughly one such week in five.
Week 4 is the one worth acting on, and only because weeks 1 and 3 exist to compare it against. A single check landing on week 4 would have told you that you are visible in AI Overviews, which on this evidence would be wrong three weeks out of four.
How do I get mentioned without auditing Google by hand every week?
Automate the capture, keep the judgement.
The manual version is genuinely expensive: even twenty prompts checked properly, reading which sources were cited rather than just whether your name appears, is an hour you will stop spending by week three. That is the real failure mode, not any individual measurement being wrong.
What automation buys you is a consistent record, which is exactly what makes a trend readable later. What it does not buy you is knowing which prompts matter, and that is the part worth your hour instead.
As for actually earning the mention, the honest answer is that we cannot tell you a mechanism from this data. We can tell you that the sources AI Overviews reaches for are largely not the ones ChatGPT reaches for, so work aimed at one should be evaluated against that one rather than assumed to transfer. Note that all of this is association rather than causation: we observe which domains are cited, not what caused them to be.
Should I treat AI Overviews as SEO or as something else?
Something adjacent, and the overlap numbers are the reason.
AI Overviews sits on Google's index, so the instinct to treat it as an extension of search is reasonable and partly right. But it agrees with Gemini, another Google product, on only 12.7% of sources, which means even within Google the surfaces diverge substantially.
The practical consequence is that AI Overview presence deserves its own line in a report rather than being folded into an organic-search number or a blended AI-visibility score. Those two framings both lose the thing that makes it distinct.
What this measurement does not settle
It does not tell you why the source sets differ. Different indexes, different retrieval, different recency windows and different answer lengths could all contribute, and we cannot separate them from citation data alone.
It also does not establish that low overlap means low transferability of effort. It is possible that the same underlying work, a genuinely better page, eventually earns citations on both surfaces through different routes. What we can say is that the observable evidence of that work, the specific URLs cited, does not transfer.
And it is one brand's prompt set on one category over one month. The 4.8% figure is ours. That the figure is small is the part we would expect to generalise.