It depends entirely on whether the prompt is one of the stable ones, and the uncomfortable part is that you cannot tell in advance. Across 320 prompt-and-engine series with at least ten runs each, 275 never changed their answer at all. On those, one check is the whole truth. On the 45 that did vary, a single check was off by 32.7 percentage points on average and landed within 10 points of the real rate only 31.1% of the time.
That is the honest shape of the answer. Most of your prompts need one run. A minority need closer to ten. Nothing tells you which is which except having run them.
Everything below comes from our own tracking between 10 July and 10 August 2026, four engines, 11 to 12 runs per series. GetIntel sells a tracker that automates this, which is a reason to check the numbers rather than take them: the dataset is published.
Why can one run be so wrong?
A single AI visibility run can only return 0% or 100%, and the truth is usually neither.
If a prompt names you in roughly half its answers, a single check reports either 0 or 100 and both are wrong by about 50 points. The error is not noise around a good estimate. It is a category error: you are reading a coin flip as a measurement.
That is why the average miss on varying prompts is 32.7 points rather than something small. It is not that the engine is unstable in some exotic way. It is that one observation of a probabilistic process is not an estimate of its rate.
How much does each extra run buy you?
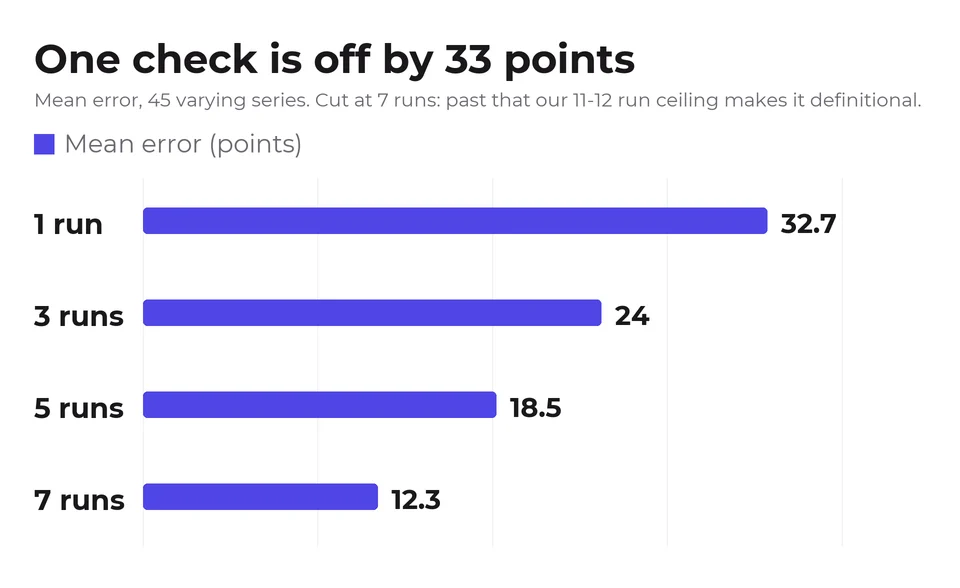
Each extra run buys a sharp drop in error at first and very little later: mean error against a series' own final rate falls from 32.7 points at one run to 18.5 at five and 12.3 at seven, measured on the 45 varying series.
| runs | mean error | within 10 points | within 20 points |
|---|---|---|---|
| 1 | 32.7 pts | 31.1% | 44.4% |
| 3 | 24.0 pts | 31.1% | 48.9% |
| 5 | 18.5 pts | 40.0% | 62.2% |
| 7 | 12.3 pts | 55.6% | 86.7% |
The practical read is that the first few runs buy you very little and the gains arrive later than intuition suggests. Three runs still misses by 24 points on average, which is worse than most people assume when they check something "a few times to be sure". Seven runs brings the error to 12.3 points, a little over a third of where it started.
So is the answer ten runs?
Ten runs is not the answer, because our AI visibility series only run 11 to 12 deep and that ceiling contaminates the tail of the table.
Each estimate is scored against that series' own final rate, which is itself computed from 11 or 12 runs, so the two share most of their data and of course they agree. The bound is exact: for a series of length N, an estimate after k runs cannot differ from the final rate by more than (N-k)/N. At N=11 and k=10 that ceiling is 9.1 points, so "100% within 10 points" at ten runs is guaranteed by arithmetic before any engine is queried. It says nothing about ChatGPT and everything about our series length.
The same bound bites earlier than we first thought. At eight runs on an 11-run series the ceiling is 27 points, which is loose enough to matter, so we have cut the table at seven runs. The 8, 9 and 10-run rows remain in the published dataset, correctly labelled, rather than in the argument.
So read the trend from one to seven runs, which is not contaminated that way, and treat anything past it as an artefact of our ceiling. We could tell you "ten runs gets you within 10 points 100% of the time" and it would be a true sentence about our data and a misleading sentence about yours.
The defensible claim is narrower: seven runs cuts the error from 32.7 points to 12.3, a reduction of about 62%, and we cannot say from this data where it flattens.
Do most prompts actually change their answer?
Most prompts never change their answer at all. Of 320 series, 275 never varied, which is 85.9% and the part that changes what you should actually do.
For those prompts, the tenth run tells you exactly what the first one did. All the rerunning in the world adds nothing, and a vendor charging you per run on those is selling you repetition rather than information.
Which means the real value of a schedule is not that it averages away noise on every prompt. It is that it identifies the minority where noise exists at all. You are not buying precision across the board. You are buying the ability to find your 14%.
This also explains a common and reasonable complaint: people run daily tracking, watch a number sit perfectly still for weeks, and conclude the tool is broken. It usually is not. Most prompts genuinely do not move, and the source lists underneath them churn almost completely while the brand answer stays put.
What should I actually do?
Do four things when you measure AI visibility, roughly in order of value: never act on a single check of a new prompt, run a burst before you run a schedule, cut cadence on the prompts that hold steady, and always report a rate with its run count attached.
- Never act on a single check of a prompt you have not run before. If it comes back without your name, that is one draw. On a varying prompt a single check missed the real rate by more than 10 points 68.9% of the time.
- Run a burst before you run a schedule. Five to seven runs of a new prompt set over a few days tells you which prompts vary. That is a much better use of budget than a daily cadence applied uniformly forever.
- Then reduce cadence on the stable ones. If a prompt has returned the same answer ten times, checking it daily is spending money to be told the same thing.
- Report a rate with its run count attached. "Cited on 3 of 11 runs" is a fact. "27% visibility" is that same fact with the evidence removed, and it invites comparison against numbers built on one run, or against numbers built on a different retrieval path entirely.
How do I tell if a drop is real or just noise?
Tell a real drop from noise by comparing it against how much the AI visibility number moves when nothing has happened.
We ran that test on ourselves. Splitting each series into its first and second half, with no publishing or campaign in between, 13.1% of all 320 series showed a swing of 10 points or more purely from noise. On the 45 series that vary at all, 93.3% did.
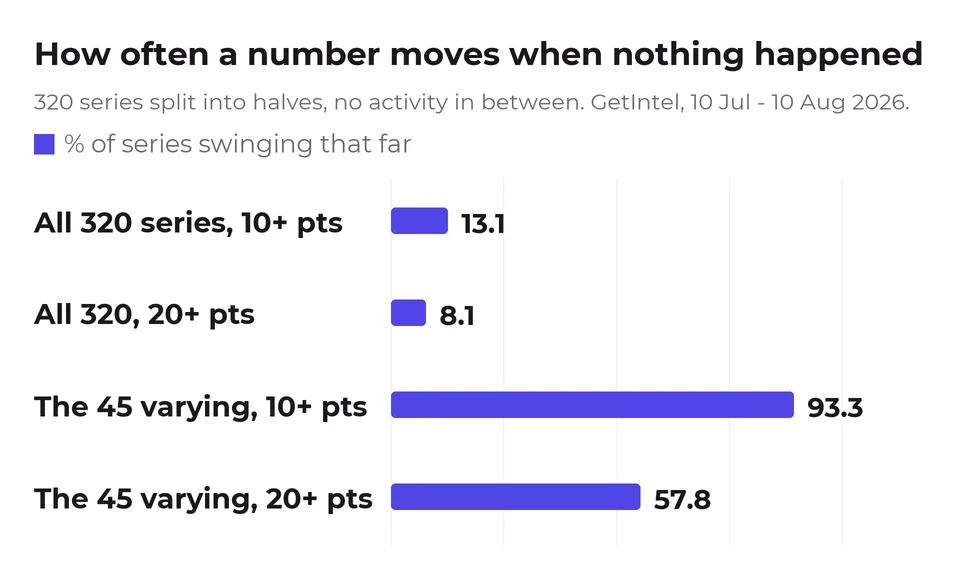
So on a prompt you already know to be unstable, a 10-point drop between two periods is close to meaningless by itself. On a prompt that has never varied, the same 10-point drop is worth investigating immediately, because that prompt has no history of moving.
One honest wrinkle: the moves were not symmetric. At the 10-point threshold, 36 series drifted up and only 6 drifted down. Some of that upward drift is real rather than noise, because our citation count genuinely grew over the window, which means this test overstates noise upward and the downward figures are the cleaner read of it.
What does this not establish?
This rerun study does not establish a general rule about AI visibility measurement. It covers one brand, one category, four engines and 45 varying series. That is a small group, and 45 series is enough to see a clear direction but not to pin a threshold.
We also measured a binary, whether the brand was cited at all. A rank or share-of-voice metric has more states and will almost certainly need more runs than this to stabilise, not fewer.
And the split between stable and varying prompts is a property of our prompt set and our category, not a law. A more contested category would likely have more varying prompts, which would raise the value of reruns and change the arithmetic above.
If you want the version that applies to you rather than to us, run your own prompts five to seven times over a week and count how many gave a different answer. That number is the only one that decides your cadence, and it takes a few days to get.
An analogous small-sample problem shows up one level up the stack: trying to correlate a visibility score against pipeline with only seven data points ran into too few readings to fit a trend against, a different failure mode from the within-reading noise this piece measures, but the same underlying lesson about not trusting a number until you know how much data actually sits behind it.