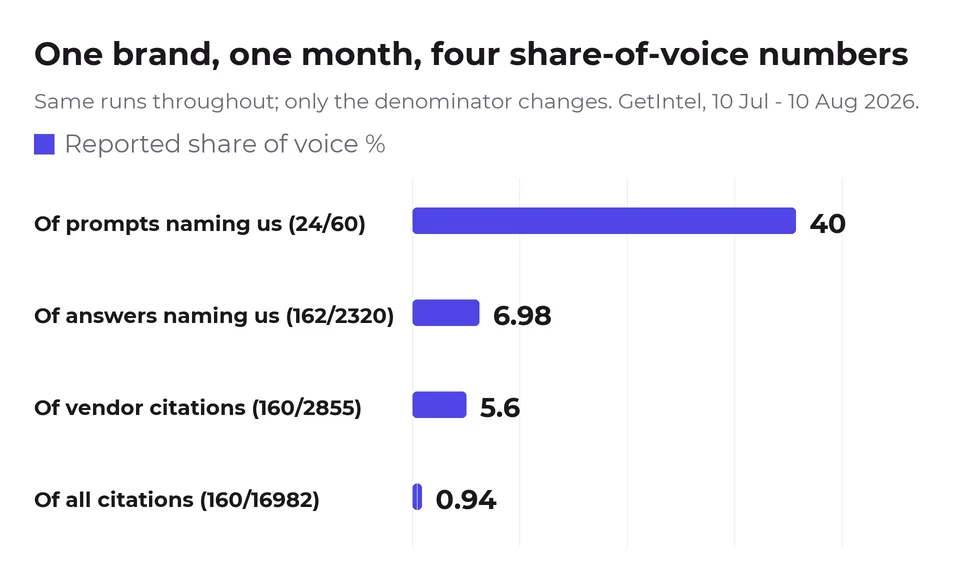
Pick your denominator first and publish it with every number, because the denominator is the measurement. The same warning applies to any single headline figure, and the ways an AI visibility score can mislead covers the sampling and drift problems underneath one. We computed one brand's share of voice four defensible ways from a single set of probe runs across 60 prompts and four engines between 10 July and 10 August 2026. The same brand came out at 0.94%, 5.60%, 6.98% or 40.0% depending only on what we divided by. That is a spread of 42.5 times with no change to the underlying data.
To do this in GetIntel, see Share of voice.
If you are the SEO manager who has to defend this number in a meeting, that spread is the thing to know before you quote it: there is no standard definition of share of voice in generative engines. Which means a share-of-voice figure quoted without its denominator is not comparable to anything, including your own number from last month if the tool changed how it counts.
GetIntel produced these numbers and sells the tracker behind them. The dataset is published.
What are the four ways to compute it?
All four ways of computing share of voice below are honest; they answer different questions.
| definition | our number | share of voice |
|---|---|---|
| Of prompts naming us at least once | 24 of 60 | 40.00% |
| Of answers naming us | 162 of 2,320 | 6.98% |
| Of citations to category vendors | 160 of 2,855 | 5.60% |
| Of all citations returned | 160 of 16,982 | 0.94% |
The bottom row divides by every domain any engine cited, which includes news sites, forum threads, documentation and academic papers. The third row divides by the 22 domains that sell tools in this category, listed in full in the dataset because a denominator you cannot inspect is not a denominator. Those two are measuring genuinely different things: one is your share of the internet's attention on these questions, the other is your share of the commercial field.
The top row is prompt-level and any-run, which is the most generous defensible reading, and it is the one most likely to appear in marketing.
Which definition should I actually use?
Use two of the four share-of-voice definitions, for two different jobs.
For tracking your own progress over time, use prompt-level any-run. It is the most stable across measurement periods because it does not move when the volume of citations moves, and it maps to a decision you can act on: which questions am I absent from.
For comparing against competitors, use share of citations to category vendors. It is the only one of the four where the denominator is a comparable field rather than an arbitrary slice of the whole internet. Our 5.60% there means something against another vendor's 5.60%; our 0.94% does not. Even then, keep it per engine: our own citation rank moves from 10th on Perplexity to 377th on Gemini, so a single blended share hides the only comparison that matters. That 377th is worth reading with its own caveat, which that piece supplies: half of Gemini's cited domains sit tied at a single citation, so it is a position inside a tie rather than a ranking.
What you should not do is mix them across reporting periods, or compare your figure to a competitor's published number without knowing which denominator produced it. On these numbers that mistake is worth up to 42x.
What tools measure share of voice in generative engines?
GetIntel measures share of voice in generative engines, and so do a number of others. What matters more than which you pick is whether the tool will show you its denominator.
The tools in this category that appear most often in our own citation data, alphabetically and in plain text because we do not link competitors: Ahrefs, AI Clicks, dageno.ai, Foglift, Frase, GetIntel, Kime, LLM Pulse, LLMrefs, Otterly, Profound, Rankability, SE Ranking, Semrush, Siftly, The Rank Masters, Trysight and Useomnia. Eighteen of them, and we have tested none of their methodologies, so this is a list of who exists rather than a recommendation. The full citation counts behind it are in our piece for agencies.
We compute all four definitions above from stored per-run citation data, which is what makes the comparison in this article possible at all. That is the capability worth checking for in any of them: not whether they report share of voice, but whether the counts above and below the line are visible to you.
The question to ask any of them, including us: what exactly is the denominator behind this percentage, and can I see the count above and below the line? A tool that cannot answer that is reporting a number nobody can check, and the same underlying data can be reported ten ways once you allow engine selection and time window to vary as well.
Why is the all-citations number so low?
The all-citations number is low because its denominator includes the entire internet the engines reached for, and that field is enormous.
Our 60 prompts returned 16,982 citations across the four engines. Those citations went to well over a thousand distinct domains, most of them cited once or twice. In that context 0.94% is not a poor performance so much as an almost meaningless fraction, in the way that a share of all web pages would be.
This is why the all-citations denominator is the one to be most suspicious of when someone reports it as a headline. It is technically the purest and practically the least informative, and it flatters nobody, which is occasionally why an honest-looking vendor picks it.
Does share of voice tell you anything useful at all?
Share of voice tells you less than a plain citation count does, which is the uncomfortable conclusion.
Every figure in the table is a fraction whose denominator you chose. "Named on 24 of 60 tracked prompts" carries its own denominator and cannot be restated later. "40% share of voice" is the same fact with the evidence stripped out, and it invites exactly the comparisons that are invalid.
We would report the count and let the reader divide if they want a percentage. That is unusual advice from a company selling a dashboard, and it is what the same analysis across ten reporting choices pushed us toward.
One honest discrepancy in our own data
The answer-level count is 162 and the citation-level count is 160.
Two runs are flagged internally as mentioning us but did not produce a parseable getintel.ai citation URL, most likely a malformed or redirected link. The gap is 1.2% of the smaller figure and does not change any conclusion here, but reconciling it silently would have been the easier and worse choice.
We mention it because it is exactly the kind of thing that produces two slightly different share-of-voice numbers from the same system, and a tool that never shows you a discrepancy like this is probably hiding one.
What this does not cover
All four definitions here are citation-based. None measures whether a brand is named in an answer's prose without being cited as a source, which is a real form of visibility our instrumentation does not capture.
The vendor denominator rests on our own classification of which 22 domains sell tools in this category. Reasonable people would move a few in or out, and doing so moves the 5.60%.
And this is one brand over one month in one category. The 42-fold spread is ours. That a spread exists is a property of there being no agreed definition, which is not ours at all.