A single AI visibility score is a noisy snapshot, not a verdict. Identical queries produced materially different ChatGPT answers in 34% of cases, while brand citations changed in 28% of responses, so the score should be read as a repeated trendline and checked against referral and pipeline signals, not treated as a one-time absolute number.
To do this in GetIntel, see Why numbers differ between screens.
That challenges the most popular advice in this category: watch the dashboard, celebrate the lift, and optimize toward a higher number. The dashboard can be useful, but it doesn't observe the full universe of buyer questions, it doesn't control every engine variable, and it can't tell you whether a mention helped or harmed your brand.
I've watched teams brief leadership on a daily increase that disappeared in the next few probes. I've also seen a brand's citation count look healthy while the answer described it as expensive, outdated, or unsuitable. Those failures don't make AI visibility measurement pointless. They make measurement design more important than the headline score.
The problem affects every vendor, including GetIntel and its own daily topic scores. A credible system should make that limitation visible rather than hiding it behind a polished chart.
Table of Contents
- The Number on the Dashboard Is Not the Metric You Should Care About
- Read the curve, not the point
- Sampling Bias, Prompt Variability, and Engine Drift
- Engine drift changes the baseline
- Interface output is part of the measurement target
- A Real Scenario Where the Daily Score Misled the Team
- What probably happened
- Citation Ambiguity, Coverage Versus Relevance, and Competitor Naming
- A mention isn't a recommendation
- Naming can corrupt competitive comparisons
- How Do You Validate a Score Against Pipeline?
- Build a repeatable observation layer
- Cross-check the business signals
- Where Can Our Own Scores Still Mislead You?
- What the model can and can't attribute
- A Decision-Grade Measurement Checklist for AI Visibility
The Number on the Dashboard Is Not the Metric You Should Care About
Reviewed 19 September 2026. The number on the dashboard is usually the easiest part of AI visibility to understand and the least reliable part to interpret. It compresses observations from a fixed prompt set, selected engines, and a particular collection window into one value. That value can answer a narrow question, such as whether a brand appeared across those probes, but it can't prove total market presence or explain what real buyers encountered.
Teams often import habits from traditional search measurement. A Google ranking or Search Console impression is tied to a defined search environment and a first-party reporting system. AI answer monitoring works differently. A tool sends controlled prompts, captures responses, identifies mentions and citations, and models a result from those observations. The result is directional evidence, not direct access to every conversation taking place inside an answer engine.
A useful explanation of how these metrics differ from traditional search appears in this guide to AI visibility scores. The key distinction is simple: a snapshot describes what happened in a sample, while a trendline helps estimate whether the pattern persists.
Read the curve, not the point
Read the curve rather than the point: a daily score becomes more useful when the same probes are rerun consistently over time. Identical prompts, comparable engine coverage, and preserved answer captures allow a team to distinguish a durable movement from a single unusual response. Even then, the chart should show uncertainty, not just a clean line that implies precision.
A score can move for several reasons:
- Prompt composition: The selected questions may overrepresent one buyer need and underrepresent another.
- Answer randomness: The engine may produce a different cited set without any change in the brand's underlying authority.
- Engine conditions: Model versions, retrieval behavior, geography, interface state, and personalization can change the observed output.
- Semantic interpretation: A parser may count a mention without understanding whether the answer recommended, criticized, or merely listed the brand.
These are seven related failure modes across two broad classes, statistical instability and semantic ambiguity. Sampling bias, prompt variability, engine drift, interface differences, citation weakness, relevance errors, and competitor naming can all distort the number before a leadership team sees it.
Practical rule: Treat a daily score as an observation that needs context, not as a business outcome that needs applause.
The first question shouldn't be, “Did the score rise?” It should be, “Did recommendation quality improve across the buyer questions and engines that matter, and can we connect that change to downstream behavior?” That shift prevents a dashboard from becoming a decision substitute.
Sampling Bias, Prompt Variability, and Engine Drift
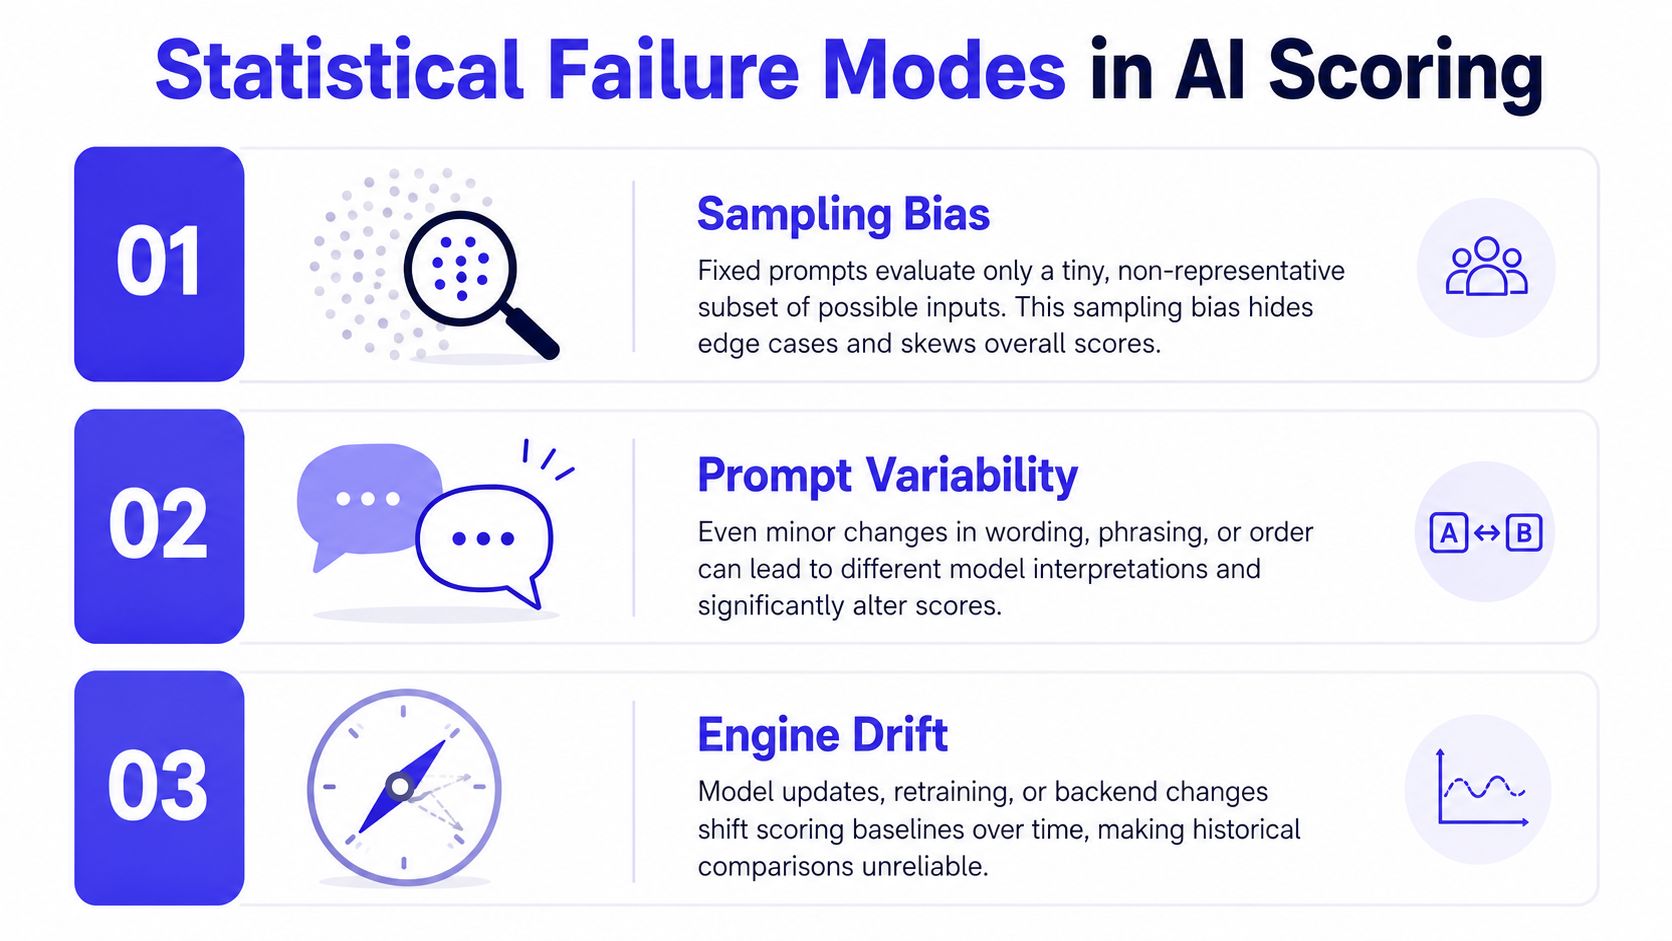
Sampling bias comes before prompt variability and engine drift, because AI visibility measurement starts with a sampling problem. A prompt library represents only a slice of the questions buyers might ask, and the slice reflects the choices made by the person who designed it. Category prompts, pricing prompts, alternative searches, comparison questions, and problem-led questions can produce very different visibility patterns. A score built mostly from one type can look strong while missing the questions closest to purchase.
Prompt wording adds another source of variance. Small changes in phrasing, context, location, or implied buying criteria can alter which sources the engine retrieves and which brands it names. Independent testing found that identical queries produced materially different ChatGPT answers in 34% of cases, and brand citations varied in 28% of responses (Texta's analysis of answer variability). A narrow probe set can therefore make ordinary response randomness look like a strategic gain or loss.
Engine drift changes the baseline
The measurement environment also changes underneath the analyst. A model update, retrieval change, interface adjustment, or geography-specific result can alter the answer set even when the prompt remains identical. A 2026 study found that, across a 45–46-day testing window, source-set overlap between consecutive days was only 34% to 42%, while brand-set overlap was 45% to 59% (the study on measuring visibility in AI search). In plain language, a source or brand can appear in one run and disappear in the next without a corresponding change in market authority.
That finding changes the burden of proof. A movement should be called real only after repeated probes show that it survives normal response variation. The exact number of repetitions depends on the prompt universe, engine mix, and historical variance, so a universal probe threshold would be false precision. What teams can establish is a baseline distribution, then compare new observations with that known noise.
Interface output is part of the measurement target
API responses and live interface answers aren't automatically interchangeable. A buyer may see citations, follow-up context, formatting, regional behavior, and surrounding answer language in an interface that a sanitized API response doesn't reproduce. If the business question is “What does a buyer see?”, the capture method should preserve the relevant interface-rendered answer and its citation context. The practical workflow is to preserve raw outputs, version prompts, record engine conditions, and report the spread alongside the central estimate. Without that evidence layer, the dashboard may conceal whether a score moved because the brand became easier to find or because the sample happened to land differently.
A Real Scenario Where the Daily Score Misled the Team
A representative B2B SaaS team saw its topic score jump twelve points in a single day. The marketing lead assumed a recently published comparison page had worked, shared the chart with leadership, and started planning a broader content push around the apparent win.
The next three daily probes erased the bump. The score returned toward its earlier range, while the team found no corresponding improvement in qualified conversations or pipeline. The original explanation, that the new page had suddenly changed the brand's authority, was possible but unsupported.
What probably happened
A forensic review would separate the event into several plausible contributors:
- Prompt mix: A small group of high-intent comparison prompts may have carried disproportionate weight on the day of the increase.
- Engine behavior: One monitored engine may have changed its retrieval or answer pattern, shifting the brand into more responses.
- Paraphrase effects: A single reworded question may have produced a different cited set and changed the aggregate result.
- Citation counting: The brand may have appeared in the answer without receiving a favorable recommendation.
None of those explanations requires a real change in buyer preference. The score recorded an observation, then the team supplied a causal story before testing the observation against repeated evidence.
A second team reading the same chart as a trendline would have handled the event differently. It would have preserved the answer captures, checked the prompt-level distribution, compared engines separately, and waited for the next probes before escalating the finding. It might still have credited the page later, but only after the movement persisted and aligned with other signals.
A spike without a causal narrative is a lead for investigation, not a result to announce.
The same discipline applies to drops. A one-day decline doesn't justify removing content, changing positioning, or confronting an agency. Teams should first ask whether the movement exceeds their historical noise and whether the affected prompts map to an important commercial use case.
A moving weekly average can make the pattern easier to read, but it shouldn't replace the raw distribution. Smoothing can hide instability if analysts use it to make an erratic series look calm. The defensible record includes the daily observations, the prompt-level results, engine splits, and the business signals that followed.
Citation Ambiguity, Coverage Versus Relevance, and Competitor Naming
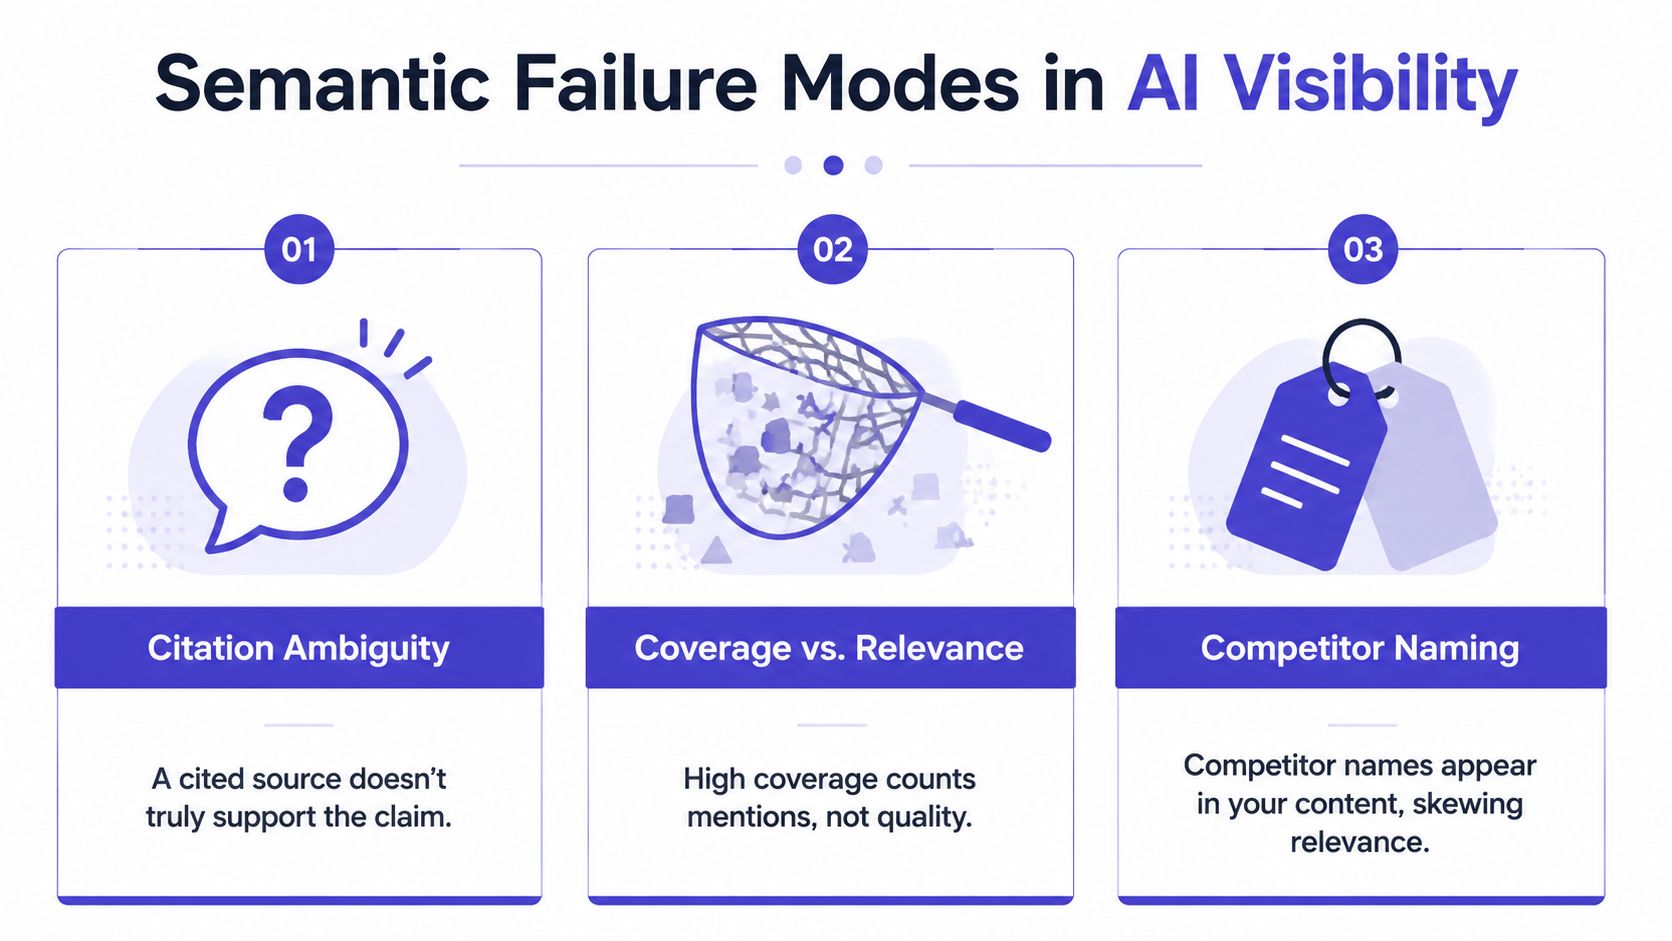
A stable score can still be wrong in meaning. Citation presence looks objective because it produces a URL, but the URL may not support the specific claim attached to it. A peer-reviewed Stanford-led analysis published in April 2025 found that 50% to 90% of large language model responses were not fully supported by the sources they cited (the Stanford-led analysis). That finding weakens any scorecard that treats citation count as a direct proxy for authority.
A separate retrieval-augmented generation study reported that up to 57% of citations lacked faithfulness, meaning the cited source didn't support the claim being made though we cannot name the study it comes from. The measurement consequence is uncomfortable: a brand can gain citation share because an engine selected a nearby or semantically related source, not because the brand's evidence became more influential.
A mention isn't a recommendation
Coverage asks whether the brand appeared. Relevance asks whether the appearance helped the buyer. Those are different metrics.
| Observation | What a basic score may record | What an analyst should inspect |
|---|---|---|
| Brand listed among vendors | Mention detected | Position, qualification, and recommendation language |
| Brand cited in an answer | Citation detected | Whether the source supports the claim |
| Competitor named beside the brand | Share of Voice increased or decreased | Why each vendor was included |
| Brand mentioned in a warning | Visibility gained | Sentiment, risk, and likely buyer interpretation |
A brand can appear as an expensive, outdated, legacy, or unsuitable option. Counting that appearance as a win rewards harmful context. For high-intent buyer prompts, the distinction matters more than raw frequency because the answer can influence shortlists before a click occurs.
Naming can corrupt competitive comparisons
Competitor analysis has its own trap. A vendor name may overlap with a feature, location, generic term, or unrelated entity. A literal parser can attribute every occurrence to the competitor, inflating its apparent presence and distorting Share of Voice. Entity matching needs context, not just string matching.
The defensible approach is to segment before aggregating. Separate metrics by engine, prompt type, recommendation status, citation-context alignment, and entity confidence. The AI citation gap framework is relevant here because the gap isn't just “we have fewer citations.” It may be that the wrong page is cited, the claim is unsupported, or the brand appears in an unhelpful answer position.
A headline score can remain useful as an index, but it shouldn't conceal these dimensions. If the dashboard can't show the underlying answer context, the analyst should treat the number as a screening signal rather than a conclusion.
How Do You Validate a Score Against Pipeline?
The safest validation workflow begins by accepting that visibility is not an outcome. A brand can appear in an answer without generating a visit, a lead, or a sales conversation. Conversely, an AI-influenced buyer may visit through a channel that doesn't preserve the original discovery path, so last-click reporting can understate the effect.
The workflow needs both controlled measurement and first-party business evidence.
Build a repeatable observation layer
Start with a fixed, versioned probe set. Record the prompt wording, engine, market context, answer capture, cited sources, detected brands, recommendation framing, and timestamp. Don't replace prompts when results look inconvenient, because changing the sample destroys comparability.
Run identical probes daily and report the distribution, not only the mean or composite score. A useful reporting package includes:
- Trendline chart, showing daily observations over the chosen window.
- Variance table, separating engine and prompt-type behavior.
- Prompt coverage map, showing which buyer questions the sample represents.
- Citation audit, testing whether cited pages support the associated claims.
- Referral reconciliation sheet, matching AI-attributed or AI-referred sessions with analytics data.
- Pipeline view, connecting relevant accounts, conversions, and influenced opportunities in the CRM.
The rule of thumb is conservative: a movement under two standard deviations of historical noise should be treated as inconclusive. That threshold isn't a universal law, and teams should document how they estimate historical noise. It is a guardrail against shipping a major decision because of a small movement inside normal volatility.
Cross-check the business signals
Analytics should identify AI-referred sessions as a distinct source where the data supports that classification. Then compare session quality, conversion behavior, and assisted or influenced pipeline with the visibility trend. Industry benchmarking has found that AI-referred sessions are a distinct traffic source and that AI citations can correlate with non-branded organic traffic, which is why downstream AI referral and citation research belongs beside the score rather than beneath it.
This doesn't prove that a citation caused a sale. It creates a triangulation framework. A durable increase in favorable recommendations, relevant citation quality, AI-referred engagement, and qualified pipeline is much stronger evidence than any one of those signals alone.
Decision standard: Don't ask whether the score is high. Ask whether the observed change is repeatable, favorable, commercially relevant, and supported by independent signals.
That standard also protects against false negatives. If visibility rises but tracked referrals don't, the team should investigate non-click exposure, attribution gaps, and answer framing before declaring failure. Measurement works best when it exposes uncertainty instead of forcing every observation into a yes-or-no verdict.
Where Can Our Own Scores Still Mislead You?
GetIntel's topic scores deserve the same skepticism as any competing score. They're built from repeated buyer-style probes across supported AI engines and surface alongside Share of Voice and Average Citation Rank. That structure can help teams connect observed movement to the underlying work, but it doesn't eliminate sampling noise or engine volatility.
The score still depends on the prompt library, the selected engines, the collection window, and how the captured answers are interpreted. A small prompt set can overrepresent a category question. A single engine can shift its output within the same measurement period. A daily absolute number can look authoritative even when its underlying observations are dispersed.
What the model can and can't attribute
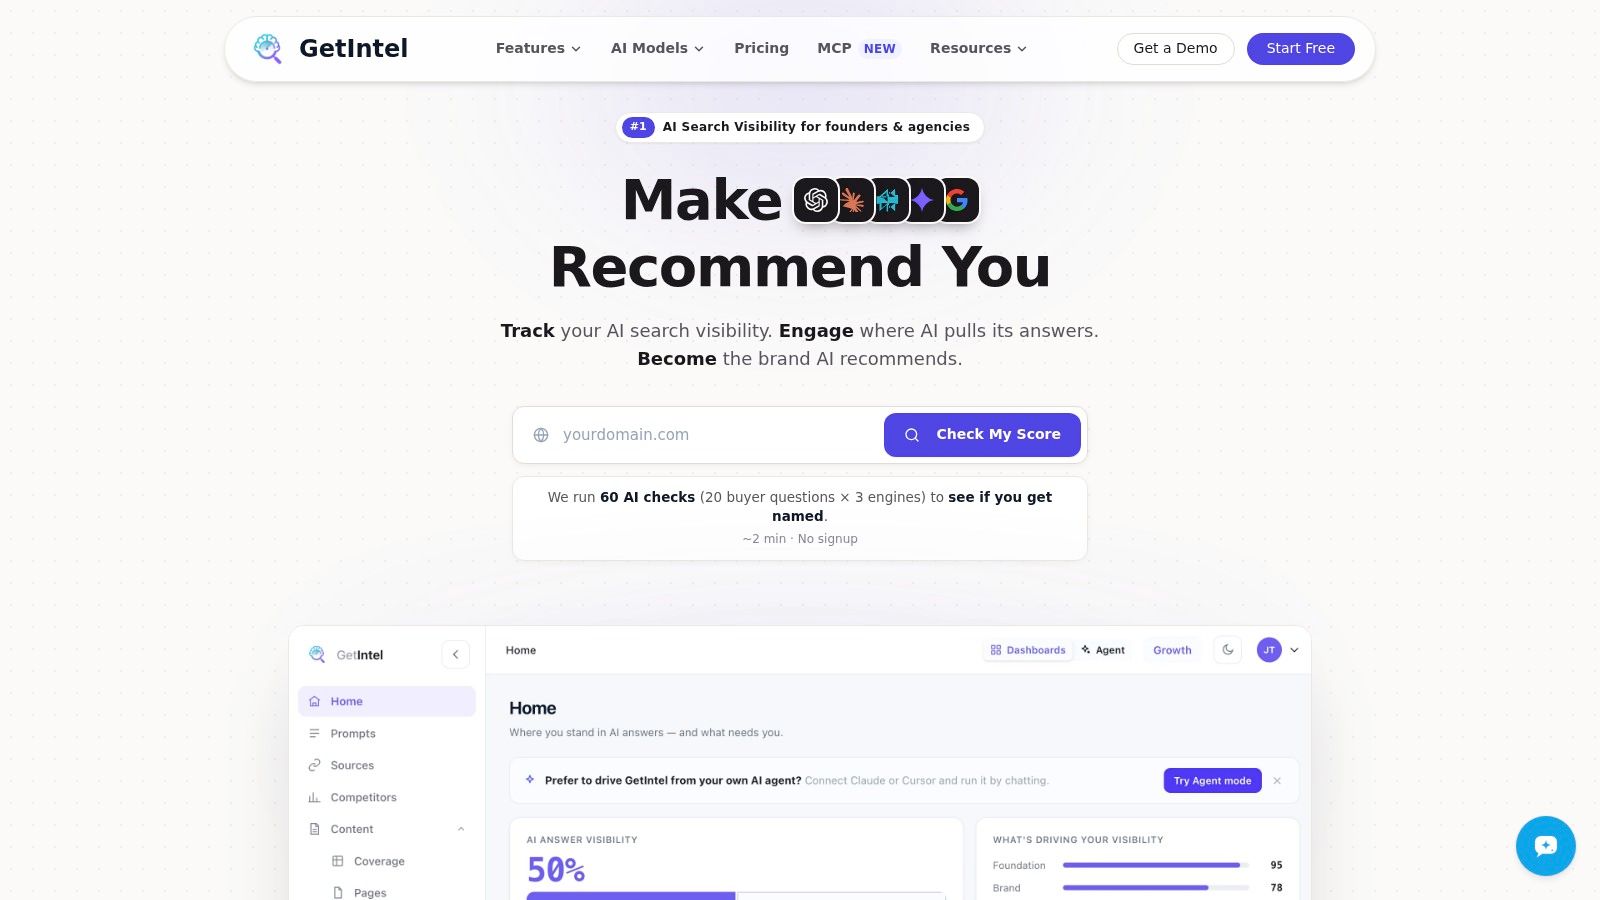
Breaking a score down by topic and by engine can organize diagnostic evidence. A pricing topic stuck on "Absent" points toward a different fix than a comparison topic where you're "Mentioned" but never recommended first. Reading the answer states across topics can surface where a mention converts, where a competitor gets named instead, and where no brand is named at all.
Those attributions are useful hypotheses, not causal proof. If the score rises after a content change or a technical fix, the timing doesn't establish that the change caused the movement. The team still needs repeated probes, answer-level review, and business validation.
Customers should demand the underlying distribution when the score moves sharply. That means asking:
- Which prompts changed?
- Which engines changed?
- Did mention quality improve or only mention frequency?
- Did citation-context alignment improve?
- Does the movement exceed historical variance?
- Did referral or pipeline signals move in a compatible direction?
GetIntel's interface-rendered answer capture is intended to mirror what users see more closely than sanitized API output, but it still captures sampled observations rather than every buyer interaction. The honest interpretation is conditional: trust the score as a monitored index when the prompt set is stable and the trend is consistent; escalate to raw captures and referral reconciliation when the number moves unexpectedly.
A product dashboard should make that uncertainty easy to inspect. If it doesn't, the analyst has to supply the missing discipline.
A Decision-Grade Measurement Checklist for AI Visibility
A defensible program should leave an audit trail that another analyst can reproduce:
- Fix and version the prompt set, then map it to real buyer questions.
- Run identical daily probes across the chosen engines and markets.
- Report the median score and variance, not a headline value alone.
- Validate citation quality, including claim-source alignment and answer framing.
- Audit competitor context, including entity ambiguity and recommendation status.
- Review monthly for engine drift, prompt coverage gaps, and changes in business signals.
The operating artifacts should include llms.txt, Schema.org markup, Wikidata entries, counter-articles, and outreach emails, with each change logged against the relevant prompt and pillar.
The goal isn't a higher dashboard number. It's a defensible answer to two questions: Are the engines that matter recommending us in the right context, and is that discovery moving pipeline?
GetIntel measures buyer-prompt visibility across AI answer engines, captures interface-rendered answers, tracks citations and competitors, and connects observed changes to repeatable trend histories. Visit GetIntel to inspect whether your current score reflects durable recommendation visibility or short-term sampling noise.