Stop using a binary. Score every prompt by the share of runs that name you, then sort ascending, and the invisible ones are not just the zeros at the top of that list. On our own 60 tracked prompts, averaging 38.7 runs each between 10 July and 10 August 2026, 36 never named us at all. A further 11 named us in 10% of runs or fewer. So 47 of 60, or 78%, sit at or below one mention in ten runs, while a covered-or-not metric would report 24 of them as covered.
That gap between 24 covered and 13 above one-in-ten is the whole problem with how this normally gets measured. The 10% line is our judgement call rather than a derived threshold, and a stricter or looser cut would move the 13; what does not move is that a binary counts a single lucky run as a win. All 60 prompts here are buying-intent, each seeking a tool or vendor rather than a definition.
GetIntel sells the tracker that produced these numbers, and the numbers are unflattering to us, which is roughly the point. The dataset is published.
Why does a covered-or-not metric hide the problem?
A covered-or-not metric hides invisible prompts because it counts one lucky run the same as consistent presence.
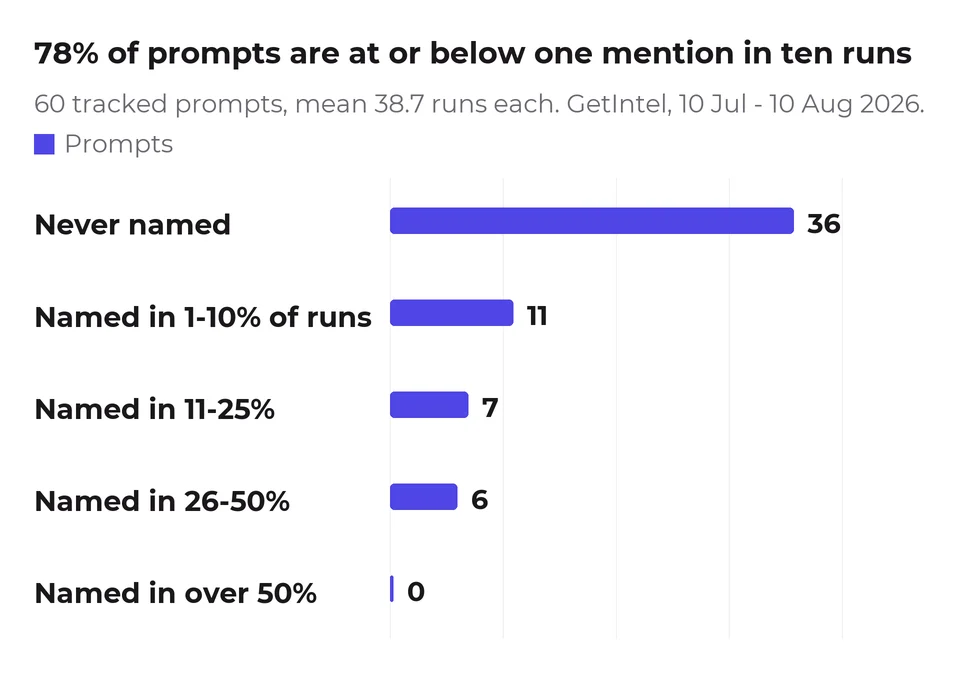
| how often we are named | prompts |
|---|---|
| Never | 36 |
| 1-10% of runs | 11 |
| 11-25% | 7 |
| 26-50% | 6 |
| Over 50% | 0 |
Six of the 24 prompts, of 60 tracked, that name us at all named us exactly once, across roughly 39 runs each. Under a binary those six are wins. In practice they are indistinguishable from noise, and a single appearance on a prompt that varies tells you almost nothing.
The median prompt that names us does so 13.9% of the time. Our best result on any prompt is 40.9%. Not one of the 60 names us in a majority of its runs, so any metric requiring dominance would score us at zero.
How do I actually find them?
Find your invisible prompts in four steps, none of which need a tool you do not already have if you are willing to do it by hand once: list the questions buyers actually ask, run each one repeatedly on every engine, record the rate rather than a flag, and sort by how close the question sits to a purchase.
- List the questions buyers actually ask, in their words. Not keywords. The phrasing matters because that is what gets typed.
- Run each one repeatedly, on every engine you care about. Repeatedly is the part people skip, and it is the part that separates absent from unlucky.
- Record the rate, not the flag. Named in 3 of 39 runs is a fact you can act on. "Covered" is not.
- Sort ascending and read the top of the list. Your zeros first, then everything under about 10%, which on our numbers is most of what remains.
The manual version is genuinely feasible for twenty prompts once, and it is the first step of doing this without an agency at all. It is not feasible weekly, which is the honest case for automating it rather than any claim about accuracy.
And do it per engine, because the answer changes completely depending on which one you ask:
| engine | prompts that never name us, of 60 |
|---|---|
| Gemini | 59 |
| Perplexity | 49 |
| Google AI Overviews | 47 |
| ChatGPT | 46 |
On ChatGPT alone, 46 of our 60 prompts never name us, against 36 that are invisible across all four. So a single-engine check finds more gaps than the combined view does, and a blended score hides which engine the gap is actually on.
How many runs before I can call a prompt genuinely zero?
Calling a prompt genuinely zero takes 29 consecutive empty runs to rule out a true visibility rate above 10% at 95% confidence, far more than most people assume, and we got this wrong in the first version of this article.
The arithmetic is simple. If a prompt's true rate is p, the chance of n consecutive runs all coming back empty is (1-p) to the power of n. So to rule out a rate above 10% at 95% confidence you need 29 consecutive zero runs, not a handful.
| rule out a true rate above | at 90% confidence | at 95% confidence |
|---|---|---|
| 20% | 11 runs | 14 runs |
| 10% | 22 runs | 29 runs |
| 5% | 45 runs | 59 runs |
Seven zero runs against a true rate of 10% happen 47.8% of the time by chance. That is a coin flip, not evidence.
We originally recommended five to seven runs here, borrowed from our work on how fast a rate estimate converges. That number answers a different question: how quickly an estimate settles on a prompt already known to vary, not how much evidence confirms an absence. Our own 39 runs per prompt rule out a 10% rate at 98.4% confidence and a 5% rate at only 86.5%, which is why we are comfortable calling our 36 zeros and not much more comfortable than that.
Which invisible prompts should I work on first?
Work on the invisible prompts where you are absent and the question sits close to a purchase, then let frequency break ties.
What we would not do is sort by how strong the incumbent looks. We tested that and it does not predict anything: we appear on 44.4% of prompts that have a dominant domain against 36.4% of contested ones, so the presence of an entrenched competitor is not the obstacle it appears to be.
The more useful cut is between prompts nobody owns, where the work is to exist at all, and prompts with a stable owner, where you need to be better than a specific page. And check who actually holds the slot per engine, because the competitive field barely overlaps between them: no domain appears in all four engines' top eight. Those are different jobs and mixing them into one backlog is how a quarter disappears.
What does a realistic target look like?
A realistic AI visibility target is lower than you would guess: across our own tracked set no prompt sits above 40.9%, and none reaches 50%.
We have no prompt above 40.9% and none above 50% at all. If a tool or an agency is showing a client 80% visibility, the first question is what definition produced it, because the same underlying data can be reported anywhere between 0% and 40% depending on choices nobody discloses.
Moving a prompt from zero to any consistent presence is the real unit of progress here. Moving it to dominance is not something we have observed happening to anyone in our category, ourselves included.
What doesn't this data tell you?
Our invisible-prompt data does not tell you which prompts are worth being visible on. That is a judgement about your buyers, and no amount of citation data substitutes for it. Our 60 are ours.
It also does not explain why any particular prompt is a zero. Absence is easy to measure and hard to diagnose, and the honest answer for most of our 36 is that no page of ours answers that question directly.
And this is a single brand in a single category over one month. The 78% figure is ours. That a binary metric flatters whoever reports it is not specific to us.