Perplexity cited a median of 9 unique domains per answer across 100 buyer-intent questions we ran on 2 August 2026. But the average, 7.61, describes almost no real answer. Perplexity either cites 8 to 10 sources or it cites nothing at all. Not one answer in 100 landed between one and five.
That matters because five different vendors have published five different figures for this exact number, ranging from 4.82 to about 22, and buyers use those figures to decide how much content and how many sources they need to compete. The numbers aren't all wrong. They're mostly measuring different things and reporting them the same way.
Disclosure: GetIntel sells AI visibility tracking, so we have an interest in how this gets measured. Every figure below comes from one run we did ourselves, and the per-answer counts are downloadable as CSV and JSON so you can recompute any of it.
In this article
- How many sources does Perplexity cite per answer?
- Why do five vendors publish five different numbers?
- Does counting raw citations instead of domains change the answer?
- Which AI engine cites the most sources?
- Why the average source count misleads
- How the citation counts were collected
- What the distribution changes
How many sources does Perplexity cite per answer?
Perplexity cites nine sources per answer as a median. Across 100 buyer-intent questions on 2 August 2026, Perplexity cited a median of 9 unique domains and a mean of 7.61. The mean is the weaker number to quote, because the distribution has a hole in it: 16 answers cited nothing at all, 84 cited at least six, and zero answers cited between one and five sources. Among the answers that cited anything, the average was 9.06. No answer exceeded 10, and 38 of them sat at exactly 10, a pattern more consistent with a display ceiling than with a natural distribution.
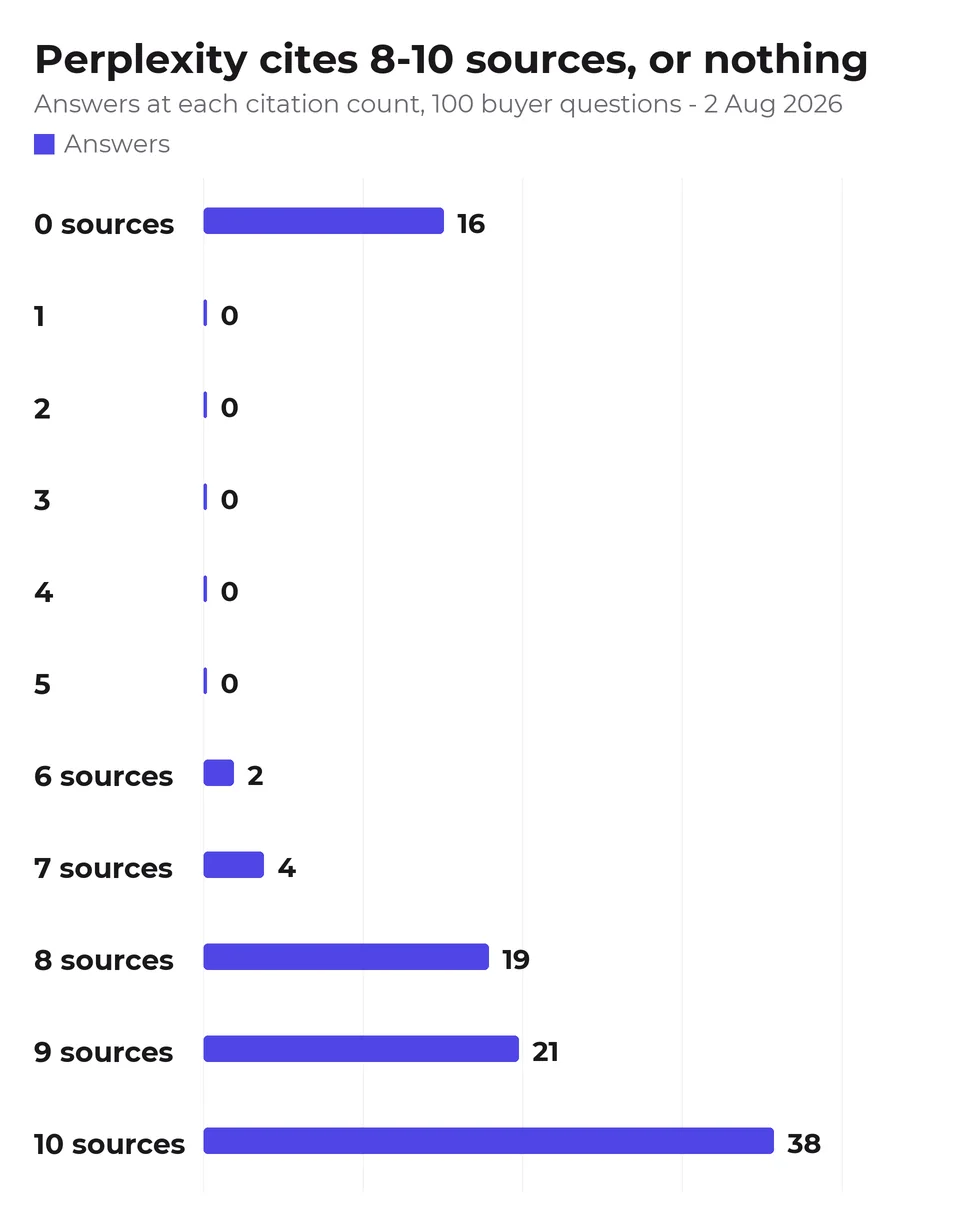
So "how many sources does Perplexity cite" has two honest answers depending on what you're asking. If you want to know what a typical cited answer looks like, it's 9. If you want to know what happens on average across all attempts, it's 7.61, and that number is doing something unusual, because it's an average of "about nine" and "none", not a description of any answer that actually appeared.
Why do five vendors publish five different numbers?
Five vendors publish five different numbers because they are not measuring the same thing. Five figures are in circulation for sources per Perplexity answer: Wellows reports 4.82 from a sample of 804,000 answers, Omnia reports 7.5 from 42 million citations, Siftly reports roughly 22, KIME gives a range of three to eight, and fifteenthmeridian gives three to seven. All five are stated as fact, and several sit side by side on pages that cite each other. We collected those figures ourselves, reading each vendor's own published page during a review of roughly 180 pages in this category on 2 August 2026, not from a roundup. We're reporting what each vendor states; we haven't audited anyone's underlying sample, and only two of the five disclose one. Our own measurement, 7.61, lands within 0.11 of Omnia's, and the spread across the rest comes down to two things: how often each sample caught Perplexity citing nothing, and whether "sources" meant raw citation slots or unique domains.
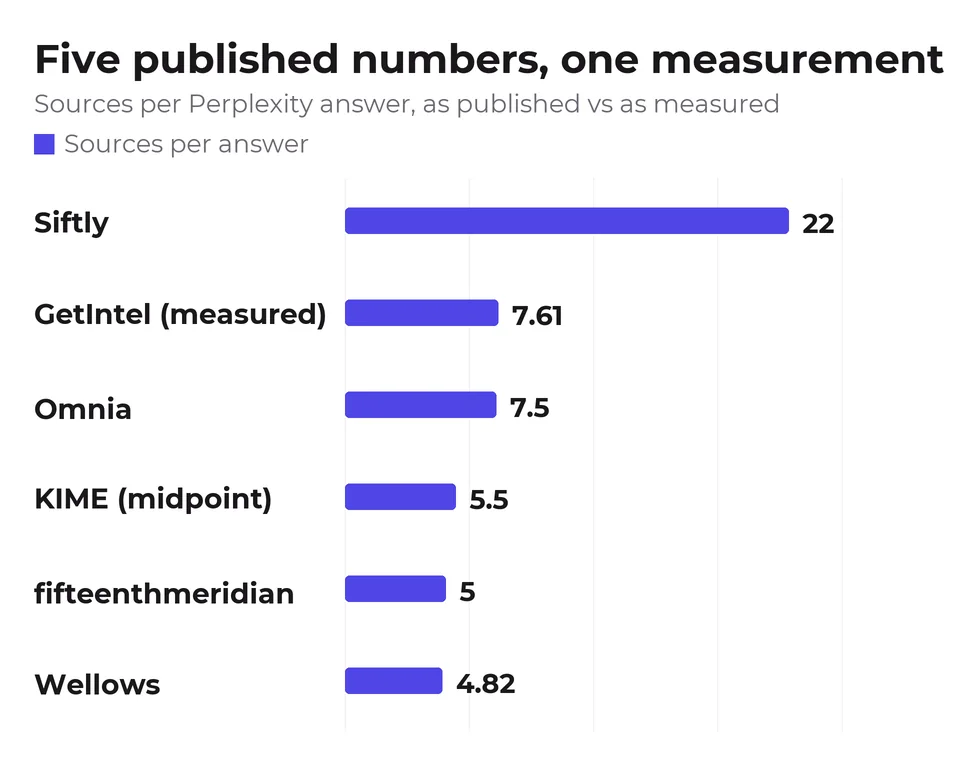
Our 7.61 lands within 0.11 of Omnia's 7.5, which is close enough to call corroboration. The lower figures are what you'd expect from a sample containing more zero-citation answers than ours: since a zero drags the mean hard, two studies can watch identical behaviour and report 4.82 and 7.5 purely from the mix of questions they asked. Commercial "best tool for X" questions of the kind we ran retrieve sources far more reliably than general knowledge questions.
Siftly's figure of about 22 is the one that can't be reconciled by sampling. It's more than double the highest count we recorded in any single answer, and Perplexity showed a firm ceiling at 10. A number that size has to be counting something other than unique domains per answer, most likely raw citation slots, or citations aggregated across a multi-step research response.
Does counting raw citations instead of domains change the answer?
Counting raw citations instead of unique domains changes the figure by 2.57x on Gemini. Gemini returned 9.00 citation slots per answer but only 3.50 unique domains, because it re-cites the same handful of sources inside a single answer. On Perplexity the same choice barely matters: 8.40 raw against 7.61 unique. So the counting rule is worth more than most of the disagreement between published studies, and it is engine-specific, which is what quietly breaks comparisons between tools.
An engine can cite the same domain several times inside one answer. Count every citation slot and you get one number; collapse them to distinct domains and you get another. We counted both ways on the same 491 answers.
| Engine | Raw citation slots | Unique domains | Inflation |
|---|---|---|---|
| Gemini | 9.00 | 3.50 | 2.57x |
| Google AI Overviews | 11.80 | 10.05 | 1.17x |
| Perplexity | 8.40 | 7.61 | 1.10x |
| ChatGPT | 3.87 | 3.66 | 1.06x |
| Claude | 5.53 | 5.27 | 1.05x |
Two tools measuring Gemini with different counting rules would report 9 and 3.5 from identical data, and both would be telling the truth. Everywhere else the two columns sit within 20% of each other, which is why the problem stays invisible until someone adds Gemini to the comparison.
The practical consequence is that a cross-engine "sources cited" comparison is only meaningful if every engine was counted the same way, and almost nobody publishing these figures says which way they counted.
Which AI engine cites the most sources?
Google AI Overviews, at 10.05 unique domains per answer, nearly three times ChatGPT's 3.66. ChatGPT is also the likeliest to cite nothing at all: 27 of its 100 answers carried no citation, against zero of the 91 AI Overviews returned.
| Engine | Raw slots | Unique domains | Answers citing nothing |
|---|---|---|---|
| Google AI Overviews | 11.80 | 10.05 | 0 of 91 |
| Perplexity | 8.40 | 7.61 | 16 of 100 |
| Claude | 5.53 | 5.27 | 3 of 100 |
| ChatGPT | 3.87 | 3.66 | 27 of 100 |
| Gemini | 9.00 | 3.50 | 6 of 100 |
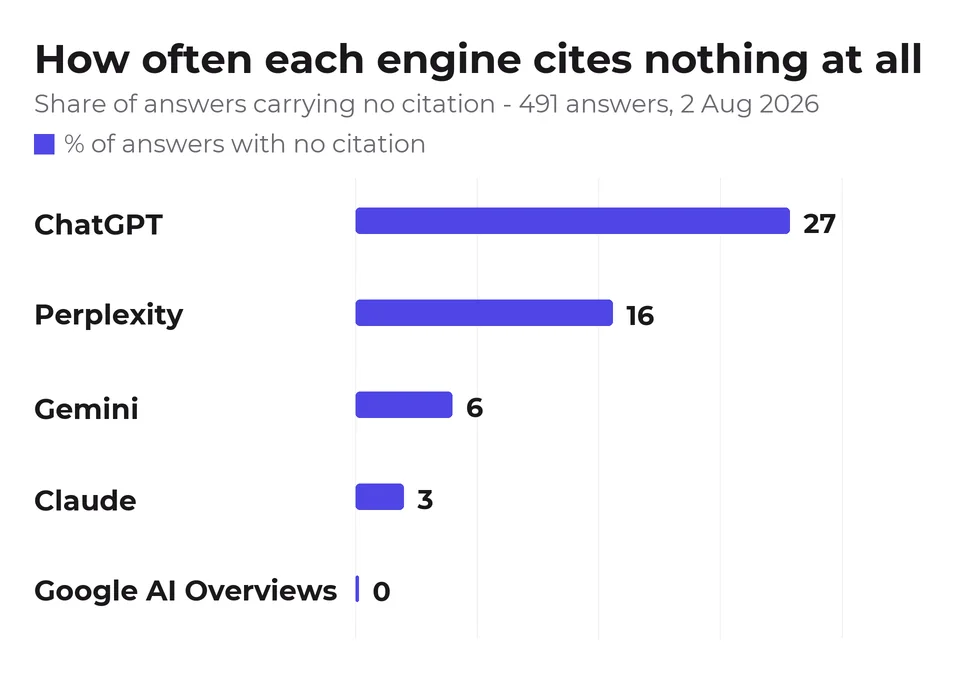
The zero column is the one worth reading. More than a quarter of ChatGPT's answers to buying questions cited no source whatsoever, while still recommending products by name, in our companion study of the same run, ChatGPT named more brands per answer than any other engine. It recommends confidently and sources sparingly. Google AI Overviews never once answered without citing.
That gap changes where effort goes. On AI Overviews, being a cited source is a realistic route to being seen. On ChatGPT, a large share of answers offer no citation slot to win at all, so being named is the only thing available, and naming is driven by what the model has absorbed about you, not by which page it happened to retrieve.
Why the average source count misleads
The average number of cited sources misleads in four compounding ways: reading the average as a typical answer, assuming more citations means more opportunity, comparing figures across studies that counted differently, and treating a one-day snapshot as a constant.
Treating the average as a description of a typical answer
Perplexity's mean of 7.61 corresponds to nothing that happened. When a distribution is split (most answers at 8 to 10, a sizeable block at zero), the median and the zero rate carry the information and the mean hides it. Any vendor publishing a single average without the spread has thrown away the useful part.
Assuming more citations means more opportunity
Google AI Overviews cites ten domains an answer, but it also names the fewest brands. Ten citation slots on a question where you aren't recommended is not ten chances to win the customer.
Comparing numbers across studies that counted differently
Gemini's own split (9.00 citation slots versus 3.50 unique domains on identical answers) shows the counting rule can move a figure by more than 2.5x. Two studies disagreeing by that much may not disagree about anything real.
Reading a one-day snapshot as a constant
AI engines change their citation behaviour over time, and this study is a single day: 2 August 2026. So is most of what is published on the question, usually without saying so.
How the citation counts were collected
We counted Perplexity's cited sources across 491 answers to 100 buyer-intent prompts, run in one day.
Date: 2 August 2026. Sample: 100 unique buyer-intent prompts across 10 software categories (customer support, CRM, project management, email marketing, HR and payroll, accounting, ecommerce, security, analytics, and meetings and scheduling), 10 questions each. Answers: 491.
Counting. For each answer we recorded the number of citation slots returned and the number of distinct registrable domains among them. An engine that errored or returned no answer is recorded as absent, not as a zero: counting a failure as "cited nothing" would invent a finding and drag every mean down.
Engines and surfaces. ChatGPT, Perplexity and Gemini were captured from their consumer interfaces; Google AI Overviews through a SERP data provider; Claude through the Anthropic API's web search tool, because no consumer-interface capture exists for Claude. Claude's numbers therefore describe the API surface, and Claude ran on Sonnet 5.
Limitations. 100 prompts is a small sample beside studies running into the hundreds of thousands of answers. Treat the pattern as more reliable than any single cell. AI Overviews answered 91 of 100; the nine misses are queries where Google rendered no AI Overview at all, excluded from both numerator and denominator. On the 16 zero-citation Perplexity answers we checked whether the citations had simply been missed in capture: those answers also never referenced a source in their prose, while 21 of the 84 cited answers did, which is consistent with genuinely uncited responses rather than a capture gap, but we can't rule the latter out entirely. And every one of these questions is commercial-intent; general knowledge questions behave differently.
Competitor figures. The five published numbers for Perplexity were captured by us on 2 August 2026, reading each vendor's own page during a review of roughly 180 pages across this category. Sample sizes are quoted where the vendor disclosed one; three of the five disclose none. We have not audited any of those samples, so treat them as accurately reported rather than independently verified.
Checking us. The published dataset is stamped with the date it was collected, and the 100 prompts are the ordinary buying questions listed above rather than a private list. Anyone can put the same questions to the same engines and compare their counts against ours, which is the point of publishing the per-answer file rather than a summary table. When we re-run it, the new dataset ships under its own date instead of overwriting this one.
The data. ai-citation-counts-2026-08-02.csv has one row per answer with both counts, the engine and the category, plus the same in JSON. Every figure on this page recomputes from it. The domain-level detail behind which sources each engine cited is published separately, alongside our analysis of how much the five engines overlap.
What the distribution changes
The shape of Perplexity's citation distribution, bimodal rather than clustered on its mean, changes the question worth asking: stop asking how many sources AI cites and start asking how often it cites you, on the engine your buyers actually use. The engine-level averages differ by nearly 3x, the counting rule can move a figure by another 2.5x, and neither tells you whether your domain is in the set.
Three things follow from the data above. On Google AI Overviews, citation is the game. It cites ten domains an answer and never abstains, so source coverage is worth real effort there. On ChatGPT, a quarter of buying answers cite nobody, so being named rather than linked is what to measure. And on Perplexity, the question isn't how many sources it cited but whether the answer to your category question was one of the 84% that cited anything at all. The zero rate is a property of the question, and finding which of your buyer questions retrieve sources tells you where a citation is even available to win.
If you'd rather not run this by hand, that's what GetIntel does. It tracks the questions your buyers ask across ChatGPT, Perplexity, Gemini, Claude and Google AI Overviews, and shows which sources each engine pulled. You can see what an engine actually answered for your category before deciding where any of this is worth your time.