
The most popular advice about measuring geo ROI is also the least reliable for AI visibility. Marketers build elaborate regional revenue models, assign citations to pipeline, and produce dashboards that look financially precise. The problem is that a generative engine citation doesn't behave like a paid search click. You can't cleanly trace a recommendation shown to a buyer in Germany to a closed deal in your CRM.
A more honest method is simpler: rerun the same buyer-prompt set every day and track whether your brand is cited consistently over time. A single citation is noise. A sustained trend across repeated daily runs is a usable signal. That doesn't replace revenue measurement where reliable attribution exists, but it prevents teams from presenting invented regional economics as fact.
Table of Contents
- Why Most Geo ROI Methodologies Are Overcomplicated
- Setting Up a Daily Probe Set for Citation Tracking
- Why Read the Trendline Instead of a Single Day?
- Building a Weekly Rollup Report for Stakeholders
- Which Geo ROI Mistakes Are Most Common?
- What Do You Do When the Trendline Stalls?
Why Most Geo ROI Methodologies Are Overcomplicated
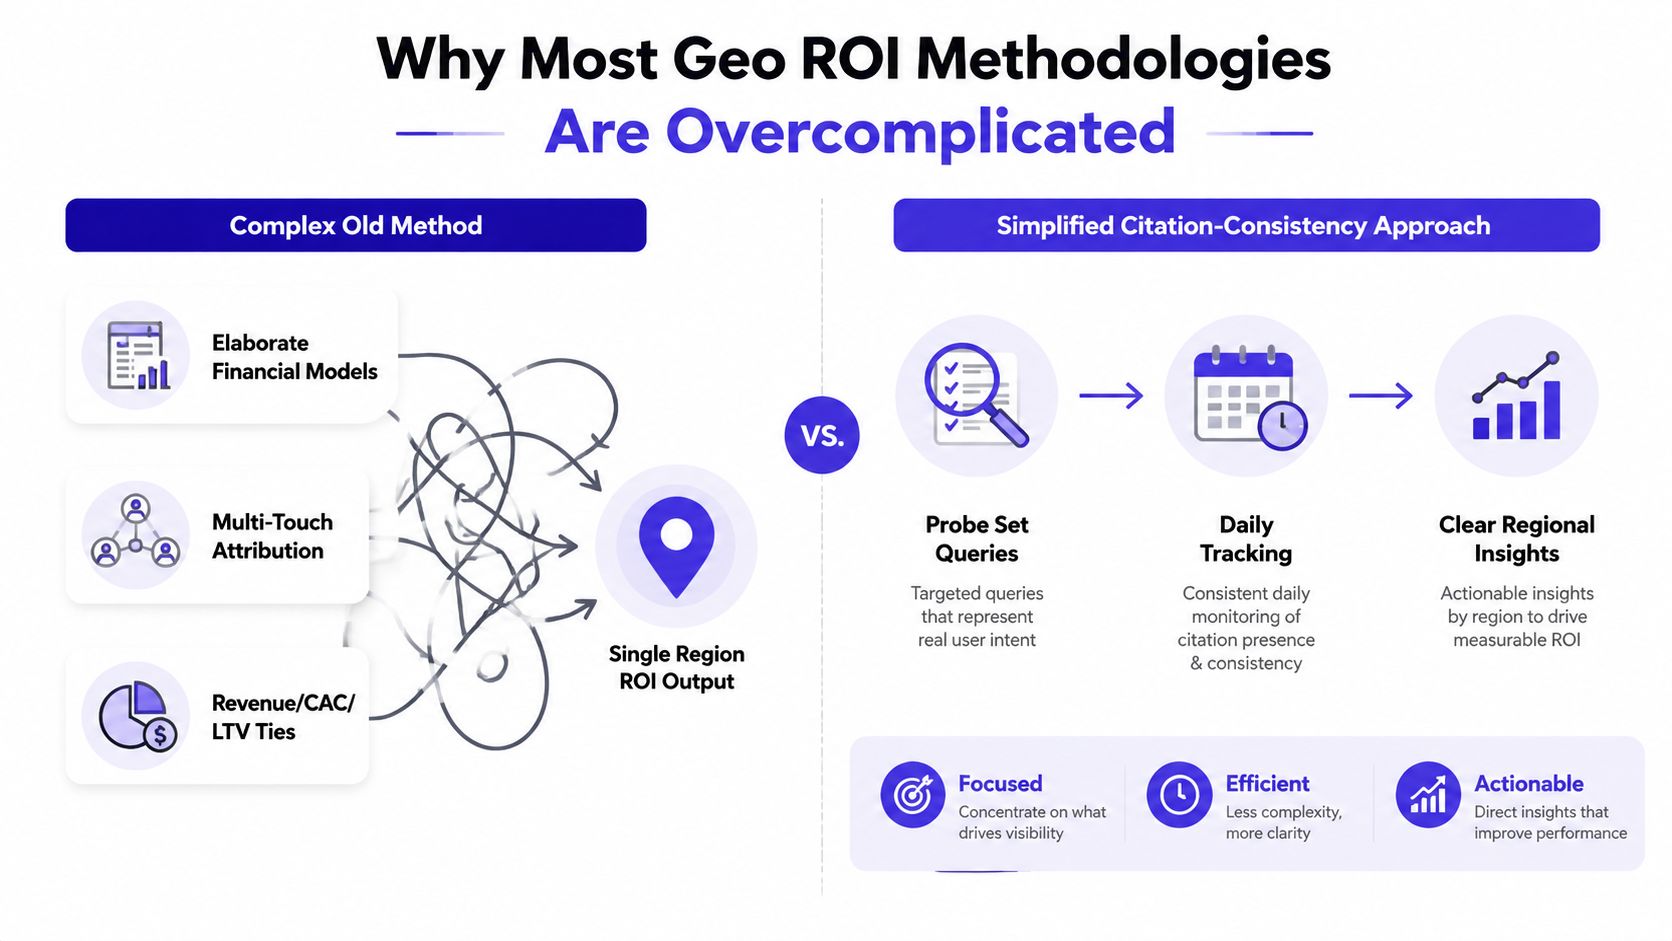
Reviewed 19 September 2026. Most geo ROI methodologies are overcomplicated because per-region models look precise until the underlying attribution disappears. They assign revenue, customer acquisition cost, lifetime value, and marketing spend to each market, which can work for paid campaigns with geographic targeting and conversion tracking. AI visibility operates differently. An assistant may generate an answer, cite a source, and influence a buyer without exposing a dependable referral path.
Formal geographic ROI still has a place when market-level financial data is reliable. One established formula defines geo ROI as (Revenue from Location - Marketing Cost for Location) / Marketing Cost for Location × 100, using geographic identifiers, location-based conversions, and aligned online and offline attribution (Stridec's geographic ROI framework). Localization programs can also express ROI as [(Net Benefit - Localization Costs) / Localization Costs] × 100, where net benefit includes revenue and cost savings.
Those equations cannot create evidence that does not exist. If a model cites your brand for a query in France, there may be no clean event connecting that answer to a later branded visit, sales conversation, or contract. Producing a per-region ROI breakdown under those conditions creates false precision. The practical signal is simpler: rerun the same buyer prompts daily and assess whether citation consistency rises across weekly trendlines.
The practical measurement boundary
The practical measurement boundary sits at citation consistency, which is a leading indicator. It answers a narrow question: does the brand appear reliably in relevant AI answers for the geography you care about? Daily probe reruns reveal whether visibility persists, while weekly rollups reduce the risk of reacting to one unusual response.
Commercial proof requires a separate standard. Independent GEO guidance recommends separating visibility from behavioral and commercial outcomes, then validating AI-influenced revenue or gross profit in CRM before claiming return (Siege Media's GEO ROI measurement guidance). Broader localization evidence reported that director-level marketers surveyed across France, Germany, Japan, and the United States generally saw positive localization ROI, with many reporting returns of 3x or greater (an international SEO statistics survey we could not trace to a named publisher). That finding can inform expansion decisions, but it does not show that a particular AI citation generated revenue.
Teams working on local discoverability can also review local SEO Google reviews 2026. Keep the boundary clear. Simple trendlines beat complicated attribution when the underlying signal is indirect.
Setting Up a Daily Probe Set for Citation Tracking
Set up a daily probe set before measuring anything. A probe set is a fixed collection of natural-language questions representing what buyers ask AI assistants in each target geography. The exact count should reflect coverage needs, but a practical starting point is 25 to 100 buyer prompts per persona, tagged by funnel stage and risk (Wrodium's GEO measurement framework). The current operating method can stay deliberately lean.
Build the set
Start with questions from sales calls, support conversations, search demand, competitor comparisons, and product documentation. Group them by intent rather than keyword alone:
- Category discovery: Which tools solve this problem?
- Evaluation: What are the strongest alternatives?
- Commercial intent: How do pricing, eligibility, implementation, or security compare?
- Local relevance: Which vendors serve buyers in the target country or region?
- Risk-sensitive research: What limitations, compliance requirements, or deployment concerns should a buyer consider?
Localize the wording. A translated question isn't always a natural question, and regional buyers may use different terminology for the same product category. Tag every prompt with geography, persona, intent, funnel stage, and risk level. This makes later comparisons interpretable without requiring an elaborate data warehouse.
Rerun the same questions
Run the full probe set at a consistent time each day. Capture the complete answer, the brands mentioned, citation sources, position or framing, and whether your brand was absent. Store the results in a spreadsheet or a visibility platform that preserves answer captures and trend history.
The important control is repeatability. Don't change the prompts because yesterday's result was inconvenient. If a prompt needs revision, version it and record the change so the trendline doesn't mix different questions.
Practical rule: Keep the probe set stable long enough to measure movement, and tag changes instead of silently replacing queries.
Semrush documents daily updates for prompt tracking and describes weekly refreshes for brand performance reporting (Semrush AI Visibility data documentation). Amplitude similarly states that AI Visibility updates weekly by default, while daily refresh mode produces events with each daily report and can generate up to 7× more events each week than weekly refresh (Amplitude's AI Visibility documentation). The operational lesson is straightforward: probe daily, report weekly.
A spreadsheet is enough to begin. A tool such as GetIntel can reduce manual capture and preserve comparable daily runs, but tooling shouldn't delay the baseline. Teams moving from manual checks to automated monitoring can use this guide to automated AI visibility monitoring for implementation context.
Why Read the Trendline Instead of a Single Day?
A single day of citation data cannot carry an ROI decision. Answer generation, prompt interpretation, index changes, and engine updates can shift the visible result even when the underlying market position stays the same. Treat the daily rerun as a probe into current behavior, then judge progress through repeated observations.
Plot each day's citation-consistency result and review the weekly direction across the same probe set. FreshNews.ai's AI Visibility Index includes consistency across prompts, reinforcing the practical point: repeated inclusion across relevant questions matters more than an isolated appearance.
Keep the chart simple. Use one line for citation frequency, another for consistency if you calculate them separately, and competitor lines when the captured data supports comparison. Mark content releases, technical changes, major campaign activity, and prompt-set revisions so later movement has an operational context.
| Scenario | Single-Day Reading | 6-Week Trendline | Correct Action |
|---|---|---|---|
| Brand appears more often after a content update | Possible improvement | Repeated upward movement | Keep the change, document it, and continue monitoring |
| Citations fall sharply for one run | Potential loss | Stable or rising direction | Don't reallocate budget from one observation |
| Competitor appears in more answers today | Possible threat | Competitor trend remains elevated | Inspect prompt clusters and source changes |
| Brand spikes briefly | Apparent breakthrough | Reversal soon after | Treat it as volatility, not ROI |
| Results fluctuate around the same level | No clear movement | Flat pattern | Audit query relevance and content coverage |
Use at least two weeks for a market test, since a shorter window can confuse weekly volatility or seasonality with a causal effect, according to ConversionWax's geo-targeting ROI method. Broader GEO reporting benefits from a fixed prompt set tracked for 8 to 12 weeks before quarterly ROI discussions. These windows create a steadier baseline, though they do not guarantee statistical certainty.
The useful question is whether the brand keeps appearing for important questions over time. A two-day decline can sit inside a strong multi-week climb, while a dramatic one-day gain can vanish just as quickly. Report the direction, duration, and plausible operational causes. That simple trendline is more defensible than a per-region formula built on unstable daily outputs.
Stakeholders need evidence of dependable visibility, not a victory screenshot from one run. A stable weekly rise in citation consistency is the ROI signal worth investigating alongside later business outcomes.
Building a Weekly Rollup Report for Stakeholders
A stakeholder report should expose decision signals, not simulate financial precision. Show whether AI visibility is becoming more dependable, where it is weakening, and what the team will test next.
Because probes refresh daily, use a weekly rollup of citation consistency. Aggregate daily observations into one view, while keeping the report separate from revenue attribution. The current methodology cannot support per-region revenue ROI, and adding a complex formula would create false confidence.
Use three visibility measures
Citation frequency records how often the brand appeared across probe runs. Citation consistency shows whether those appearances repeated for the same question set rather than arriving as isolated wins. Share of voice provides competitor context, helping distinguish a category-wide shift from a relative gain.
Include these fields:
- Geography: The market represented by the probe set.
- Citation frequency: Weekly appearances, shown as a count or rate.
- Consistency score: Repeatability across the tracked questions.
- Week-over-week change: Direction versus the previous rollup.
- Trend status: Green, yellow, or red.
- Action required: The next investigation or content change.
Use green for an upward trend sustained over at least two weeks, yellow for flat or volatile movement, and red for declining consistency. These labels guide decisions. They are not statistical claims.
| Geography | Citation Frequency | Consistency Score | WoW Change | Trend Status | Action Required |
|---|---|---|---|---|---|
| United Kingdom | 18 of 30 probes | 60% | Up from 47% | Green | Refresh the comparison guide cited in product prompts |
| Canada | 11 of 30 probes | 37% | Down from 43% | Red | Review local-source coverage and update two priority pages |
| Australia | 14 of 30 probes | 47% | Flat from 47% | Yellow | Rerun commercial-intent prompts and inspect competitor citations |
The table is useful only when its numbers lead to a clear investigation. Add a short narrative below it: identify the prompt clusters that moved, note competitor position changes, and record published or updated content. If branded search, assisted conversions, or pipeline influence move alongside the visibility trend, report them as separate business signals. Do not assign a dollar value to a citation change unless finance validates the connection.
End with next week's priorities. Name the geographies with declining consistency, the intent clusters where competitors appear persistently high, and the single action most likely to clarify the trend. Daily reruns supply the evidence. The weekly citation-consistency trendline supplies the ROI signal worth taking to stakeholders.
Which Geo ROI Mistakes Are Most Common?
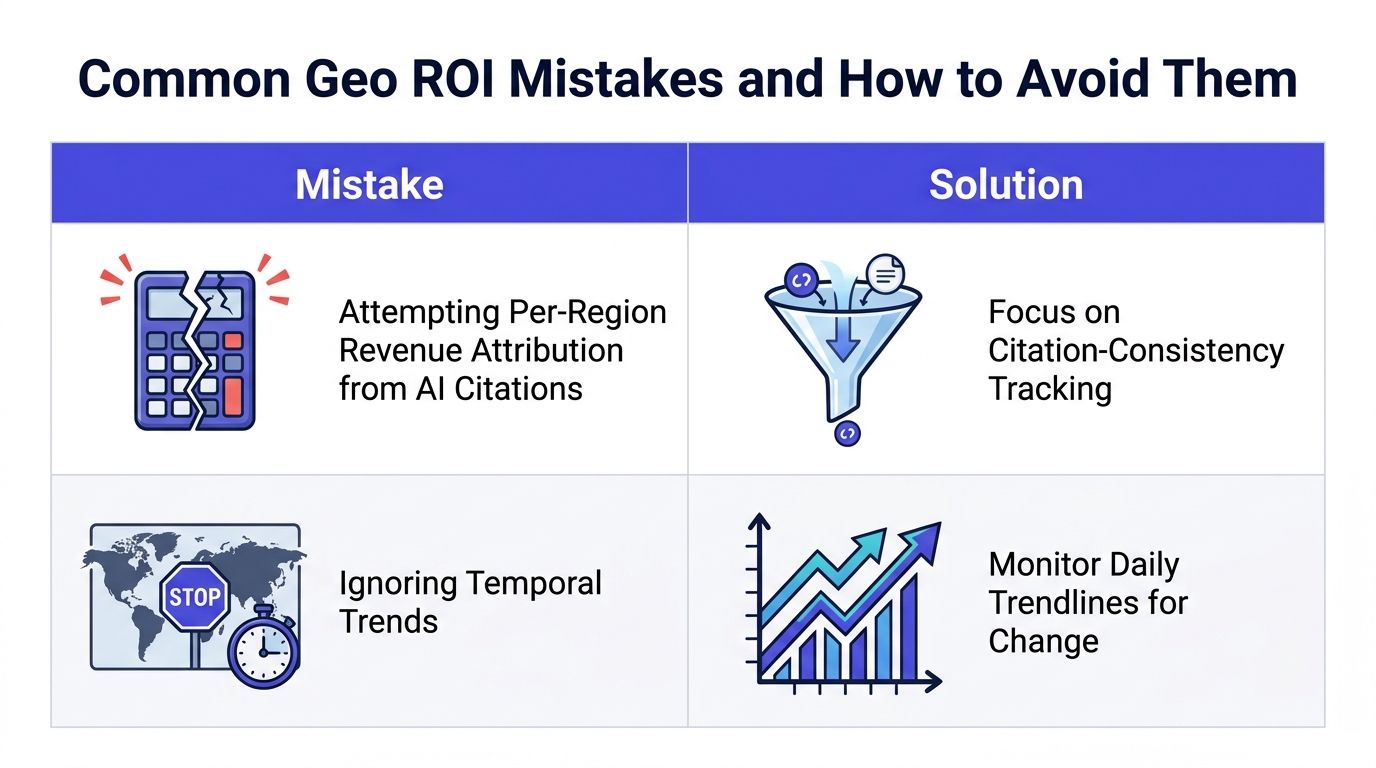
Presenting a number the evidence cannot support is the most damaging error in geo ROI measurement. AI citations can influence buyer research, but they do not automatically create attributable revenue events. Daily probe reruns and weekly citation-consistency trends provide a cleaner operating signal than elaborate regional formulas.
| Mistake | Why It Fails | Better Approach |
|---|---|---|
| Assigning regional revenue to AI citations | The answer layer may not expose a reliable referral or conversion path | Track citation consistency as a leading indicator |
| Treating a daily spike as campaign proof | Model output and prompt sampling can fluctuate | Require a sustained trend before changing investment |
| Expanding across too many markets | Thin probe coverage makes every result harder to interpret | Concentrate on a small set of priority geographies |
| Ignoring competitors | An apparent gain may reflect category-wide movement | Compare citation patterns and cited sources |
| Counting citations without intent | Low-value mentions can inflate the dashboard | Segment prompts by persona, stage, and risk |
What over-engineering looks like
A common failure begins with a dashboard that assigns each citation to a region, then applies last-click or multi-touch logic to estimate pipeline. Finance later compares that estimate with CRM results, the figures fail to reconcile, and the visibility program loses credibility. The analyst ends up defending the attribution model instead of improving the content and sources that shape answers.
Another team sees a citation spike after publishing a regional page and shifts budget immediately. Subsequent runs reverse the movement. A weekly trendline would have marked the spike as unconfirmed and prevented that reallocation.
Keep leading visibility evidence separate from lagging revenue evidence. International SEO guidance recommends auditing organic revenue by country, comparing it with international SEO costs, and normalizing currencies for financial ROI (international SEO measurement guidance we could not trace to a named sourcence). Use that approach where the data supports it. A citation signal without a dependable referral or conversion path cannot carry the same attribution burden.
Competitor context also changes the diagnosis. Citation-source intelligence can show whether an engine relies on review sites, community discussions, documentation, or regional publishers. Use targeted market research when buyer questions and market evidence need closer examination.
The practical test is simple: if a result cannot survive repeated probes and comparison with business evidence, treat it as a diagnostic clue, not ROI. Concentrate on a small priority set, compare competitors, and let the weekly consistency trend determine whether investment deserves to change.
What Do You Do When the Trendline Stalls?
A flat or declining trendline signals a need to audit your measurement setup before changing tactics. Daily probe reruns and weekly citation-consistency trends provide a cleaner decision signal than elaborate per-region ROI formulas.
Audit the evidence first
Review the probe set for outdated terminology, missing competitors, and questions that no longer reflect buyer intent. Keep the core set stable for comparison, then version or add probes when the market changes. Segment by persona and intent, since pricing, eligibility, security, and top-of-funnel questions can behave differently.
Inspect the evidence behind the captured answers:
- Freshness: Find regional pages with stale claims, outdated product details, or obsolete market references.
- Consistency: Compare language, facts, and structured data across localized site versions.
- Authority: Check which domains competitors earn citations from and whether your brand is absent from those sources.
- Framing: Read the captured answers. A citation may exist while the model still recommends a competitor.
- Coverage: Identify high-intent questions where your brand never appears.
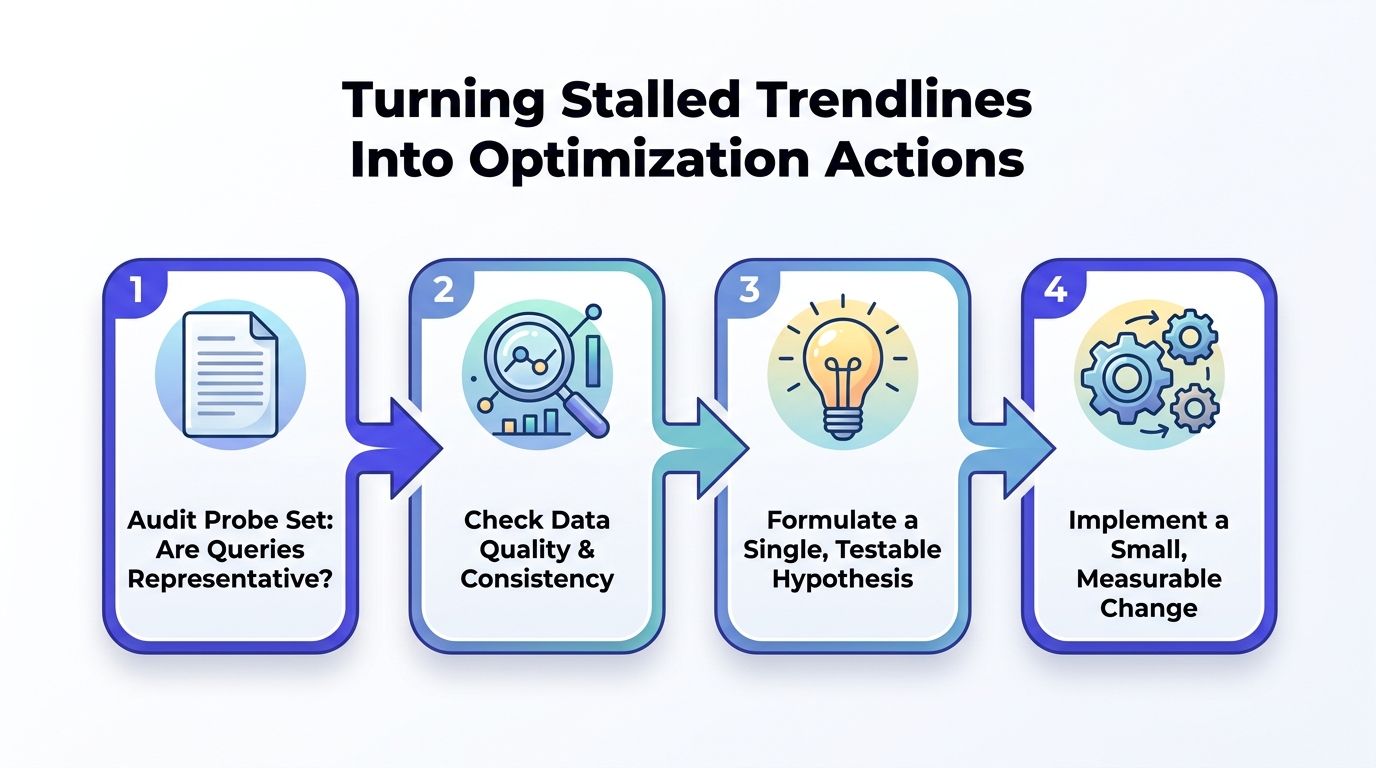
Change one variable at a time. Form one hypothesis, make one small intervention, and annotate its date in the trend history. Repeated runs over the next two weeks can show whether the movement merits further investment, following the fixed-window principle described in earlier testing guidance.
Make the next test specific
A useful hypothesis states the observed gap and its likely cause: “The brand is absent from regional implementation prompts because the site lacks a clear, locally relevant implementation guide.” The action should match it. Publish or revise that guide, state verifiable facts plainly, and monitor the affected prompt cluster.
Use the GEO content scorer for content checks, then apply human review to confirm regional relevance, accuracy, and competitive framing. Turn those changes into repeatable tests.
Document the intervention, affected prompts, publication date, and trend response. This log exposes which changes repeatedly improve visibility, while a complex ROI model can hide weak evidence behind precise-looking formulas. For the underlying framework behind separating a real signal from noise, see the AI Citation Gap Framework; for how many reruns a probe set actually needs before a trend is trustworthy, see how many reruns before an AI visibility number means anything.
GetIntel tracks buyer-prompt visibility across major AI answer engines, captures citations, benchmarks competitors, and preserves daily trend histories for the weekly rollups described here. Visit GetIntel to build a repeatable probe set, monitor citation consistency, and turn stalled GEO signals into specific optimization actions.