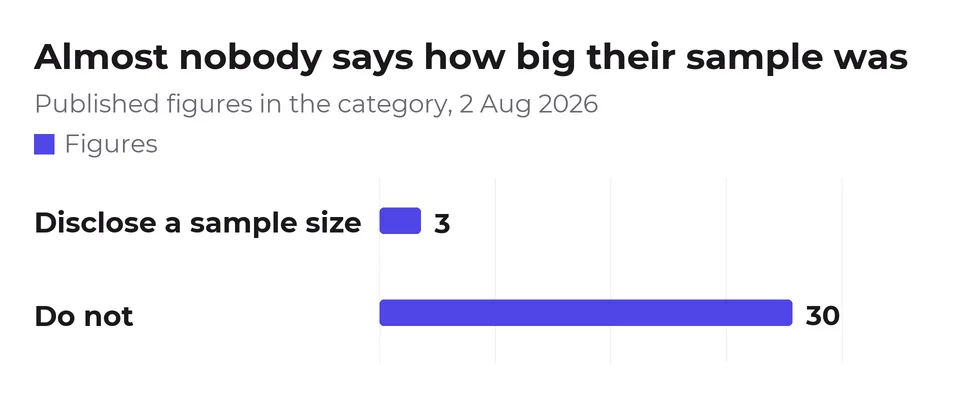
We read roughly 180 pages in the AI visibility category on 2 August 2026 and recorded every hard number they cite. Counting only figures that measure exactly the same thing, at least 12 of 18 are wrong, not as an opinion, but as arithmetic. A looser reading of the same data would let us say 17 of 24; we explain below why we didn't use it. And of all 33 figures recorded, only 3 disclose a sample size.
This is not a claim that any particular vendor is dishonest. It is a claim about what happens when a young category cites itself: a number gets published, gets quoted without its context, gets rounded, and within a few months five incompatible versions of it are all "the industry standard figure."
Disclosure: GetIntel sells AI visibility tracking. Several of the pages singled out below, including the ones we cite for contradicting themselves and for unstateable pricing, belong to direct competitors of ours, which is about as sharp as a conflict of interest gets. That is exactly why the whole audit is downloadable as CSV and JSON, every figure, its source, and whether a sample size was given, so you can check our arithmetic instead of trusting our summary.
In this article
- How many of these numbers can actually be right?
- Which numbers contradict each other?
- Which figures are unusable rather than wrong?
- Why does a whole category end up like this?
- How do you tell a usable number from a bad one?
- Why these numbers keep getting repeated
- How we checked each published figure
- How to read a vendor statistic
How many of these numbers can actually be right?
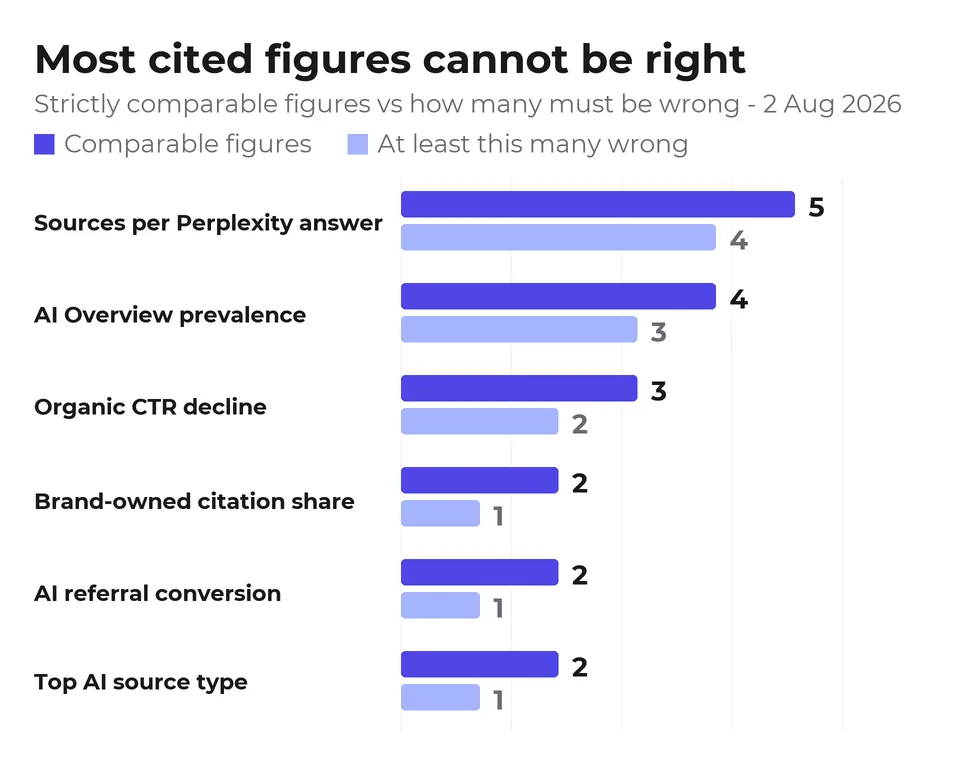
At most 6 of the 18 strictly comparable figures. When several sources publish different values for one quantity with a single true value, at most one can be correct, so the rest are wrong, whether or not anyone can say which. Take AI Overview prevalence: 25%, "nearly half", "over 60%" and 48% are all in circulation as the share of searches that show one. No more than one of those four describes reality, so at least three are wrong. Apply that across the six quantities where the comparison is clean and at least 12 of 18 published figures are wrong. A reader has no way to pick between them, so citing any one is a coin flip dressed as evidence.
The one exception is the quantity we measured ourselves. Five sources give sources-per-Perplexity-answer as 4.82, 7.5, roughly 22, three-to-eight, and three-to-seven. We ran 100 buyer questions through Perplexity and counted 7.61 unique domains per answer, which corroborates one figure and puts another about three times off. That took one afternoon and a published dataset. It is the only cluster here where anybody can say which number to use.
Which numbers contradict each other?
Sources cited per Perplexity answer, AI Overview prevalence, the organic CTR decline caused by AI Overviews, the brand-owned share of citations, conversion rates from AI referrals, and which source type AI search relies on most. Six quantities where the published values are mutually exclusive and the comparison is clean.
| Quantity | Strictly comparable figures | At least this many wrong |
|---|---|---|
| Sources cited per Perplexity answer | 4.82 · 7.5 · ~22 · 3–8 · 3–7 | 4 of 5 |
| Share of searches showing an AI Overview | 25% · nearly half · over 60% · 48% | 3 of 4 |
| Organic CTR decline from AI Overviews | ~70% · 17–61% · up to 58% | 2 of 3 |
| Share of AI citations that are brand-owned | 52.5% brand-owned · 82.9% third-party | 1 of 2 |
| Conversion rate from AI referrals | 10.5% vs 1.76% · 14.2% vs 2.8% | 1 of 2 |
| Which sources AI search relies on most | Reddit/YouTube/LinkedIn most · brand-controlled, not Reddit | 1 of 2 |
Six further figures are excluded from that count, and the reason is the whole argument of this piece. cloro's AI Overview figures are broken out by vertical (~98% commercial, ~52% travel, ~3% local) where the others are overall rates. Foglift's 92.7% is explicitly scoped to tech SaaS. And the ChatGPT-citation-overlap cluster collapses entirely on inspection: keyword.com measures overlap against Bing, KIME measures it against Google's first page, different comparison targets, while two more sources report a decline over time rather than a point value. Four published figures, not one clean comparison between them.
Counting those five would let us claim 17 of 24 wrong instead of 12 of 18. We have not, because a scope difference is not an error, and presenting one as the other would be the same move we are objecting to.
It is worth being precise about what that concession does and does not cover, though. Those differences narrow the gaps; they do not close them, and none of the pages doing the citing mentions them. A figure that is only true for commercial queries, quoted flat as "AI Overviews appear on 98% of searches", is accurate at source and wrong as used. The scoped original is fine. The citation of it is not.
Two clusters need no such caveat at all, because they are not disagreements between competitors.
One vendor contradicts itself on a single page. ZipTie's stats table gives the organic CTR decline from AI Overviews as roughly 70%, attributed to CMO Alliance. Its own body copy on the same page says 17–61% depending on query type, and elsewhere "up to 58%". A reader scrolling one page gets three different answers.
One publisher contradicts itself in a single sidebar. Two Search Engine Land headlines sit together in the same related-articles rail: "AI search engines cite Reddit, YouTube and LinkedIn most" and "AI search relies on brand-controlled sources, not Reddit." Both are presented as findings.
Which figures are unusable rather than wrong?
ChatGPT's user count, and the list prices of Peec AI, Profound and Ahrefs Brand Radar, nine figures across four quantities that genuinely change over time, so calling them wrong would itself be sloppy. Each was probably true when somebody wrote it down. The failure is that not one is cited with a date or a definition, which makes them unusable rather than false, and that needs a different fix.
The user count alone appears as 400M weekly, 800M, 900M (twice, from different sources), "almost 1 billion", and 2 billion monthly. Those are not contradictory: ChatGPT genuinely grew over the period, and weekly and monthly actives are different measures anyway. Without a date or a definition attached, a reader cannot tell whether they are looking at a stale number, a different metric, or today's reality.
Pricing is the same failure, worse. Peec AI's list price appears across seven competitor pages as €85, €89, €199, €205, €245, €425, €499, $49, and "not published". Profound appears as $99/$399, "~$499/mo", "$1,500+/mo", and "custom, demo only". Ahrefs Brand Radar shows up at $129/mo and $398/mo in the same month. Prices change; the problem is that not one of those pages says when it checked. Exactly one page in the entire audit timestamps its pricing.
The distinction matters because the two failures need different responses. A contradicted figure needs somebody to measure it. An undated figure just needs a date, and until it has one, it should not be quoted at all.
Why does a whole category end up like this?
The AI visibility category ends up this way because almost nobody is measuring. Across roughly 180 pages, original measurement is close to absent, most numbers are quoted from another page that quoted another page. The chain is rarely more than one link deep before it leaves the category entirely, and by then the sample size, the date, and the definition have all been dropped.
The sample-size numbers make this concrete. Only 3 of 33 published figures disclose the sample they came from. The three that do are the largest studies in the set, 804,000 answers, 42 million citations, and 12 million visits, which is what you would expect: people who actually ran a study say how big it was, and people quoting them do not.
There is a structural reason too. This category is barely two years old, everyone in it is competing for the same handful of head terms, and a page with a confident statistic ranks and gets cited better than a page saying "nobody has measured this yet." The incentive runs directly against admitting uncertainty.
How do you tell a usable number from a bad one?
Four checks separate a usable statistic from a bad one: whether it states a sample size, whether it states a date, whether it defines what was actually measured, and whether you can trace it to somebody who measured rather than to another blog post. Those four checks, in that order, filter out almost everything in this category, the sample-size test alone eliminates 30 of the 33 figures we audited.
Does it state a sample size? This alone eliminates 30 of the 33 figures we audited. A percentage with no denominator is a rhetorical device, not a measurement.
Does it state a date? AI engines change monthly. An undated figure about AI Overview prevalence is unusable regardless of whether it was accurate when written.
Does it state a definition? "Sources cited per answer" means two different things depending on whether you count citation slots or unique domains, on Gemini those differ by 2.57x on identical answers. "ChatGPT users" means one thing weekly and another monthly. Most published figures specify neither.
Can you trace it to someone who measured it? Follow the citation. If it terminates at another blog post rather than a study, you have found a rumour with a footnote.
A figure that passes all four is rare enough in this category that finding one is genuinely informative.
Why these numbers keep getting repeated
Three habits keep unusable AI visibility numbers in circulation: assuming the biggest number is the most reliable one, treating a wide range as though it were a measurement, and, the expensive one, resourcing a channel on the strength of a figure nobody measured.
Assuming the biggest number is the most cited one
The biggest number usually is the most-cited one, which is the problem. The most-quoted AI Overview prevalence figures are the high ones, because "60% of searches" makes a better headline than "48%". Selection pressure on statistics runs toward the dramatic, not the accurate.
Treating a range as a measurement
A range is not a measurement: "3–8 sources" and "17–61%" look like findings but describe almost nothing. A range that wide is compatible with most possible realities, so it cannot be wrong, and cannot be useful either.
Building a strategy on a number nobody measured
Building a strategy on an unmeasured number is what actually costs money. If you believe AI Overviews appear on 98% of commercial searches, you resource for a channel that dominates your funnel. If the real figure is 25%, you have over-invested by 4x against a number that had no sample size attached. The decision is expensive; the number underneath it was free.
How we checked each published figure
Date: 2 August 2026. Method: we read roughly 180 pages in the AI visibility and GEO category and recorded every hard figure, on the publisher's own page rather than via a roundup. Recorded: 33 published figures across 11 distinct quantities.
Classification. Each quantity was labelled contradiction (several sources giving different values for something with one true value at a point in time) or undated, where the quantity genuinely moves and the figures may each have been true when captured. Only contradictions are counted toward the wrong-count. This distinction is doing real work: treating all 11 quantities as contradictions would let us claim 22 wrong figures instead of the defensible 12.
The arithmetic. For each contradicted quantity with n strictly comparable published figures, at least n − 1 are wrong, since at most one value can be correct. Summed across the six qualifying quantities, that is 12 of 18. A figure is marked not-strictly-comparable when it measures a different scope or a different thing from its cluster-mates: a segmented rate against overall rates, a tech-SaaS figure against industry-wide ones, an overlap measured against Google rather than Bing, or a trend rather than a point value. Six figures drop out in total: five flagged in the dataset as measuring a different scope or a different thing, plus keyword.com's overlap figure, which is not itself problematic but is left with nothing in its cluster to be compared against once the other three go, and a lone figure contradicts nothing. The dataset carries a counted_in_headline column so this reproduces without reading the article. Counting them would give 17 of 24; treating a scope difference as an error would be the same move this piece objects to. Our own Perplexity measurement is excluded from the count as well. Including it would both inflate the total and quietly assume our number is the true one.
Limitations. We report figures as published; we have not audited anyone's underlying study, so a figure counted as "wrong" here might be the correct one in its cluster. In three clusters part of the gap is scope rather than error, as noted above. Roughly 180 pages is a sample of the category, not a census. The three pricing clusters are recorded as one row per vendor listing every price we saw, rather than one row per page, because the audit captured the set of values without attributing each to a specific page. Unbundled, the corpus would hold roughly a dozen more figures, which moves the "33" and the "3 of 33" but not the 12-of-18, since pricing is classified as undated and sits outside that count entirely. And we compete with several sources counted, which is why the raw audit is published rather than summarised.
Checking us. The dataset carries the date it was collected, and re-runs will ship under their own date rather than overwriting this one. We are not going to promise a refresh cadence we do not currently run, which is the same standard we are holding everyone else to on this page.
The data. ai-visibility-stat-audit-2026-08-02.csv has one row per figure (quantity, source, figure as published, whether a sample size was disclosed, and the classification), plus the same as JSON. Every number on this page recomputes from it.
How to read a vendor statistic
Read a vendor statistic by refusing to pass on what you cannot trace: stop quoting category numbers second-hand, and start measuring the two or three that actually drive your decisions.
That sounds like more work than it is. The Perplexity figure in this audit had five incompatible published values and we settled it in an afternoon with 100 prompts: the full run and dataset are published. Our study of 98 funded B2B SaaS companies came from the same kind of exercise. You do not need 42 million citations to beat a number that came with no sample size at all.
Practically: for any statistic about to justify a budget, apply the four checks above. If it fails on sample size or date (which 30 of 33 figures here do), treat it as a hypothesis, and measure the version of it that applies to your own category. Your buyers ask a specific set of questions, and the answer for your niche is rarely the category average anyway, which is something the citation data across engines shows clearly.
If you would rather not run it by hand, that is what GetIntel does. It tracks the questions your buyers actually ask across ChatGPT, Perplexity, Gemini, Claude and Google AI Overviews, and shows which sources each engine pulled, with the date attached.
Related: whether you can build this yourself on Zapier.
We then found five of them in our own dashboard, and an undated one made us wrongly accuse a writer of inventing data: our own visibility metric was invalid for a month.